
It’s been six months since disruptions began in the Strait of Hormuz, and oil markets have moved in tandem with the chaos.
Brent crude first shot past $100 per barrel, then $118, with forecasts through the spring warning of $150-200 in a worst-case scenario. Bunker prices moved too, but not as uniformly: the size and scale of market shifts have varied significantly by port and fuel grade, in ways a single crude benchmark or market hearsay doesn’t capture.
Bunker Insights, built with Veson’s proprietary data science modelling and available within the Veson Platform, delivers daily bunker pricing estimates across 1,300+ ports. Using historical timeseries for the four major bunkering hubs — Fujairah, Singapore, Rotterdam, and Houston — we can paint a more specific, useful picture for procurement planning.
What’s the impact on bunker prices?
Bunker Insights delivers daily pricing across three fuel grades — HFO, LFO, and MDO — that are continuously backtested by Veson’s Data Science team.
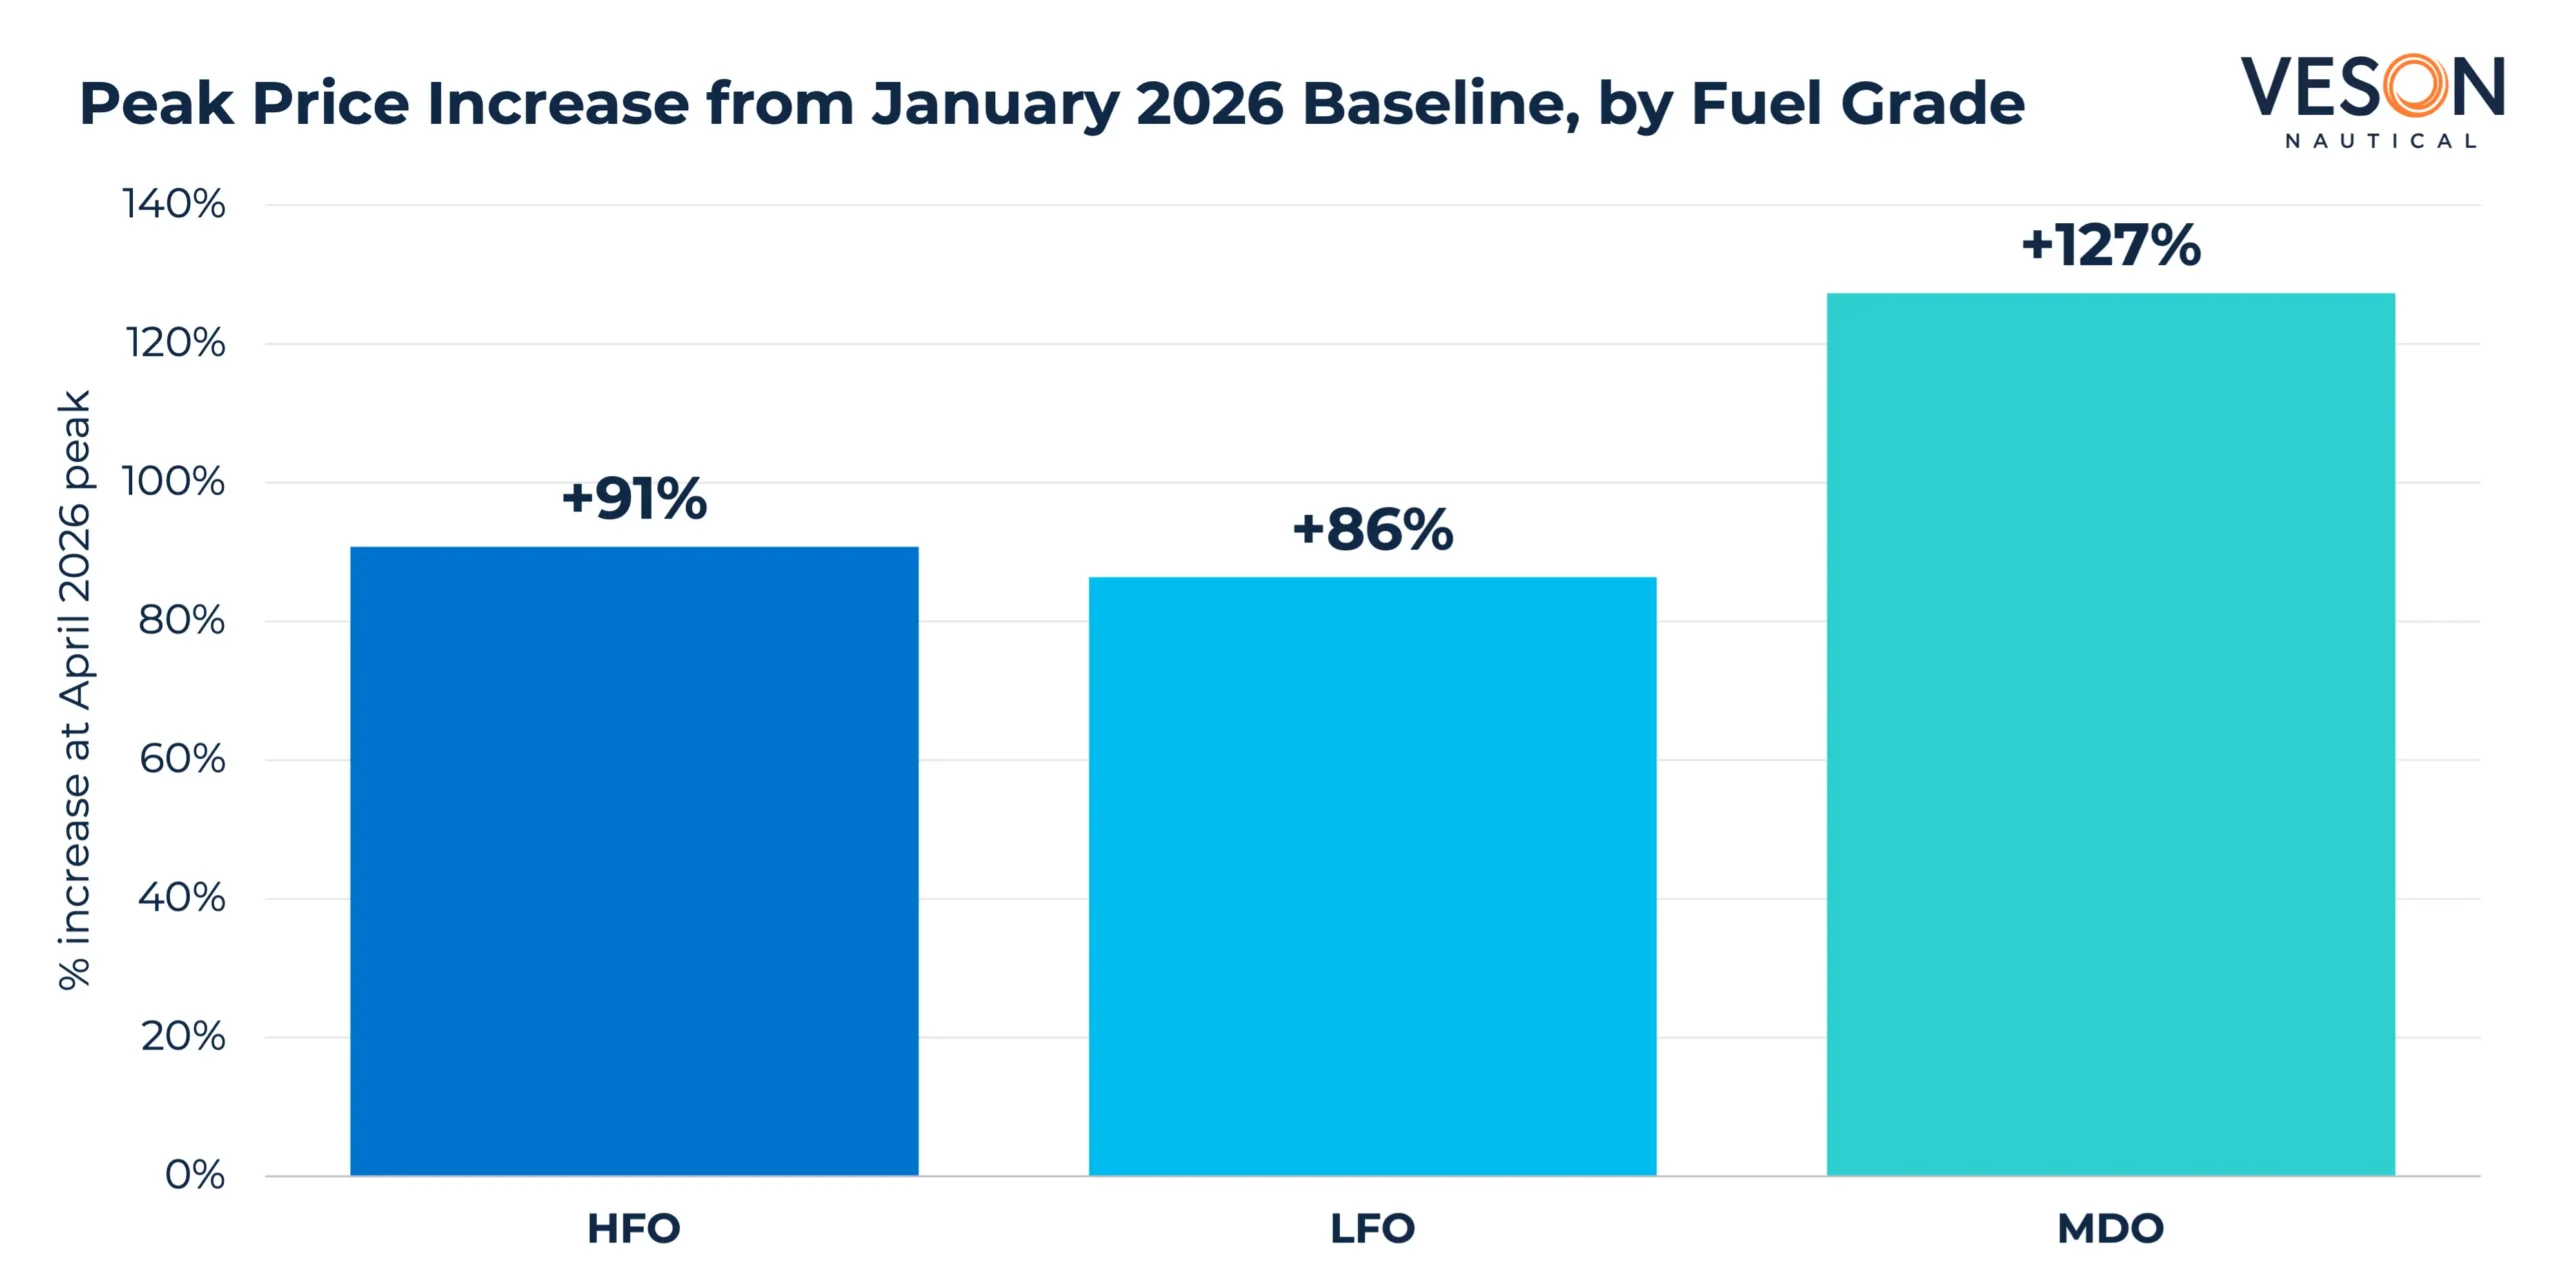
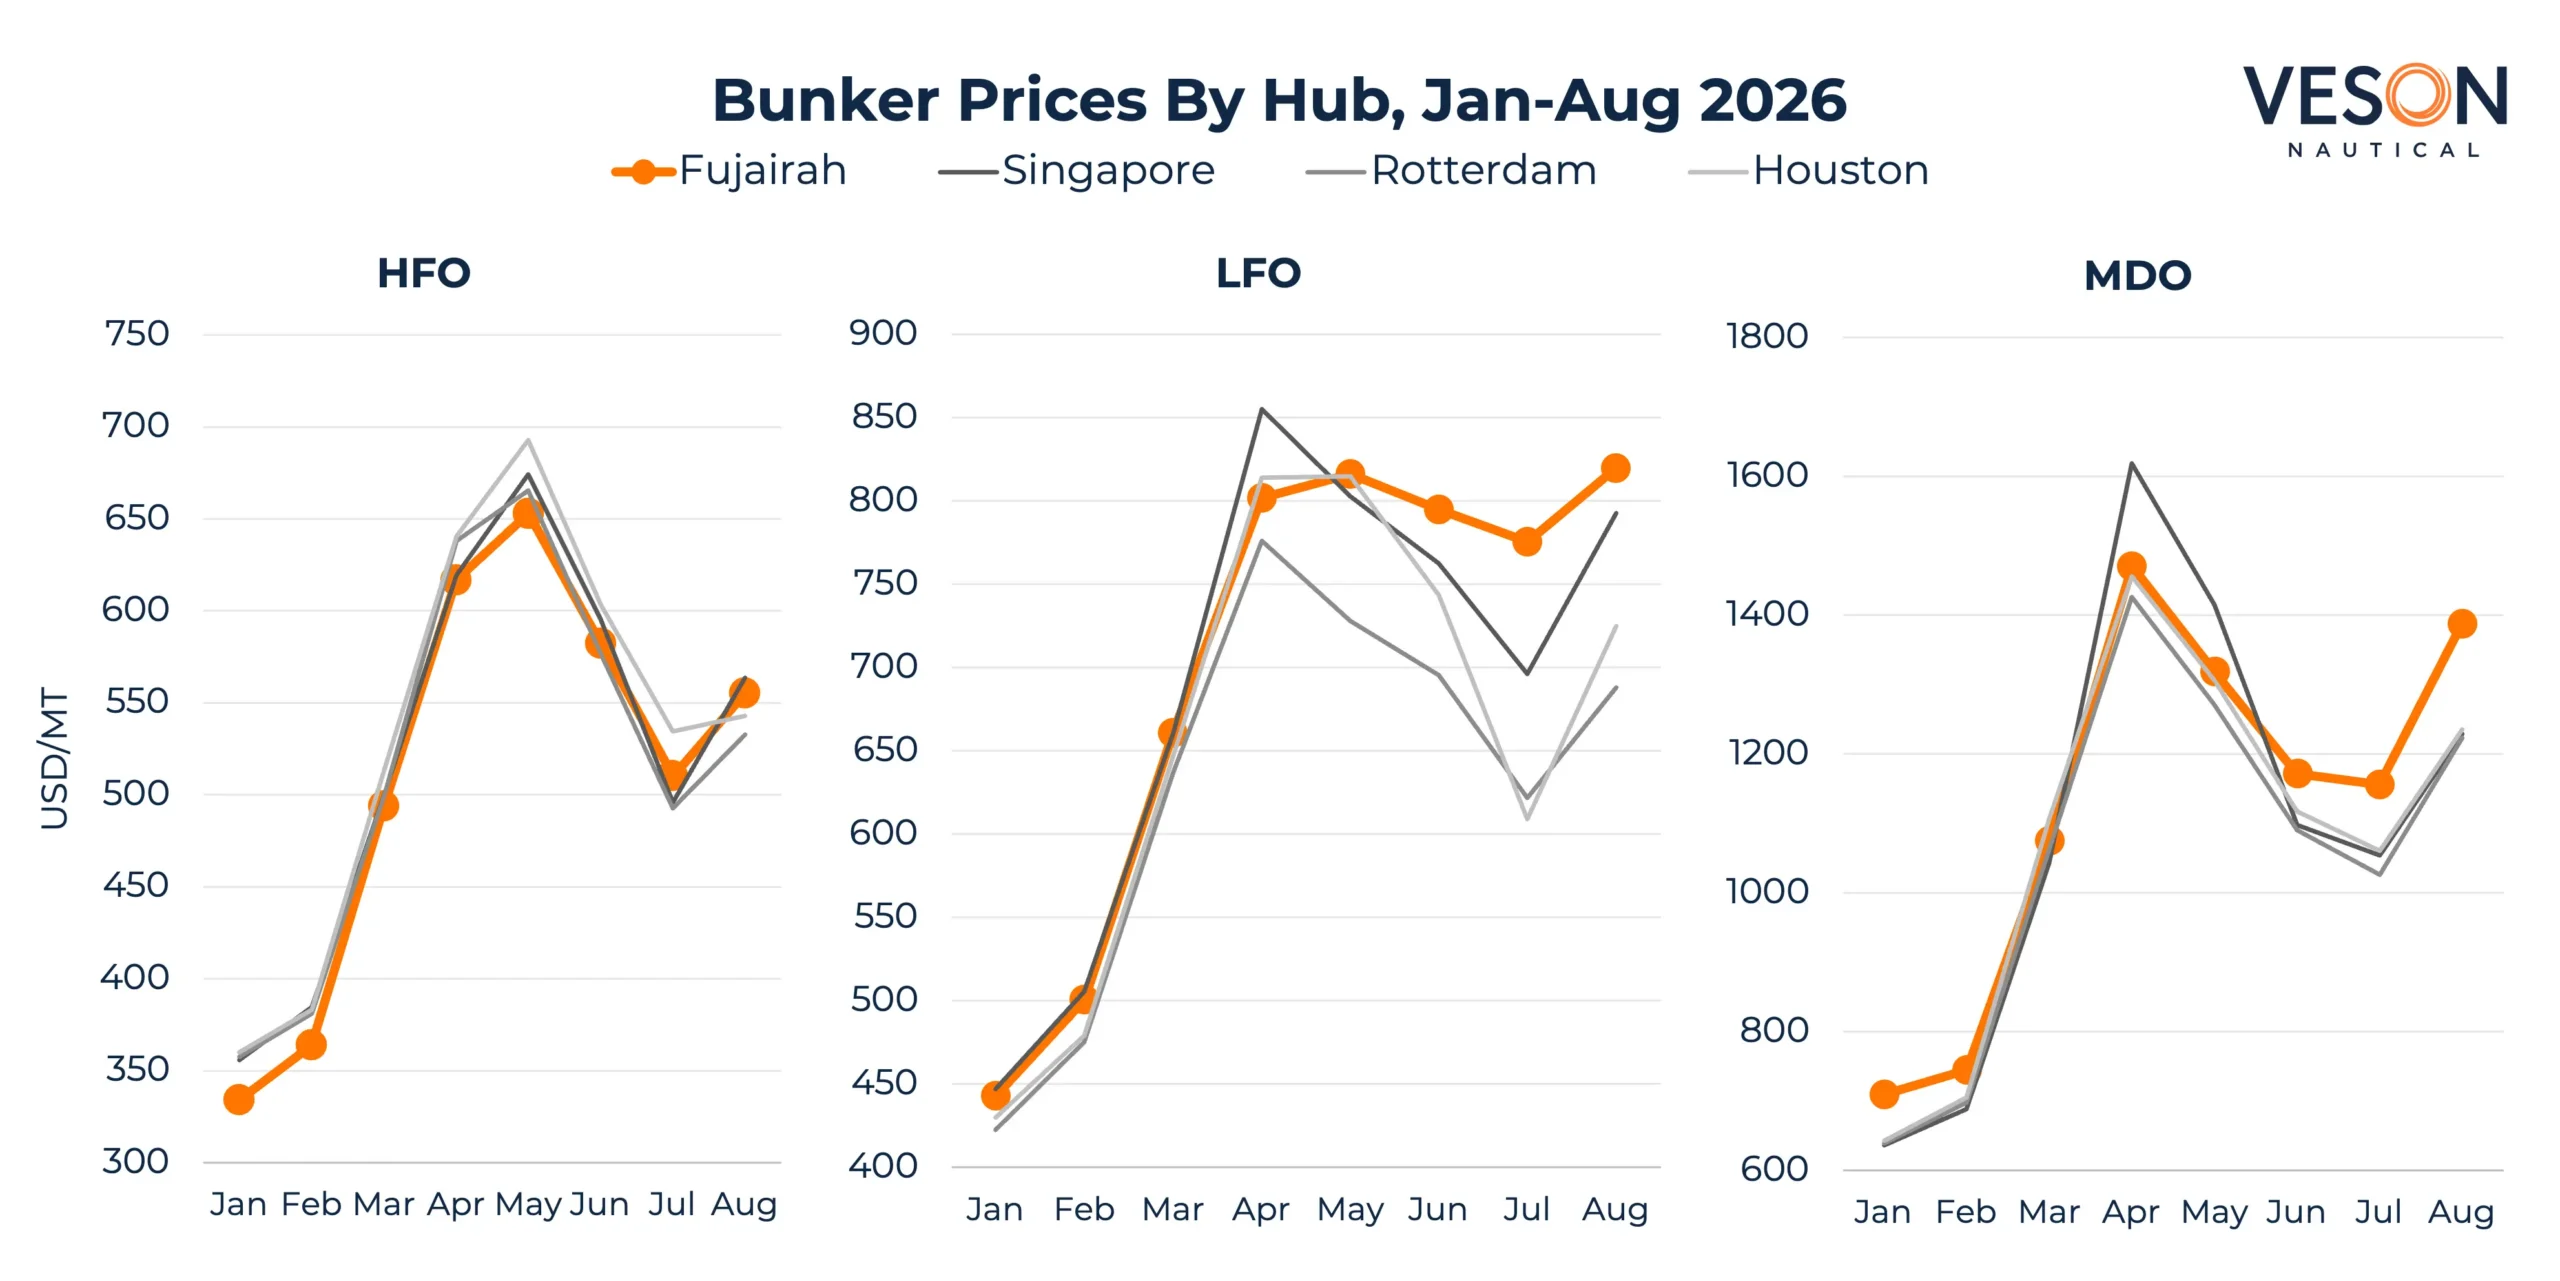
Across each fuel grade, prices show the same broad arc of a sharp move upward in March, a volatile peak in April, a partial retreat through to July and a rebound in August. However, the magnitude of these changes differed sharply by fuel grade.
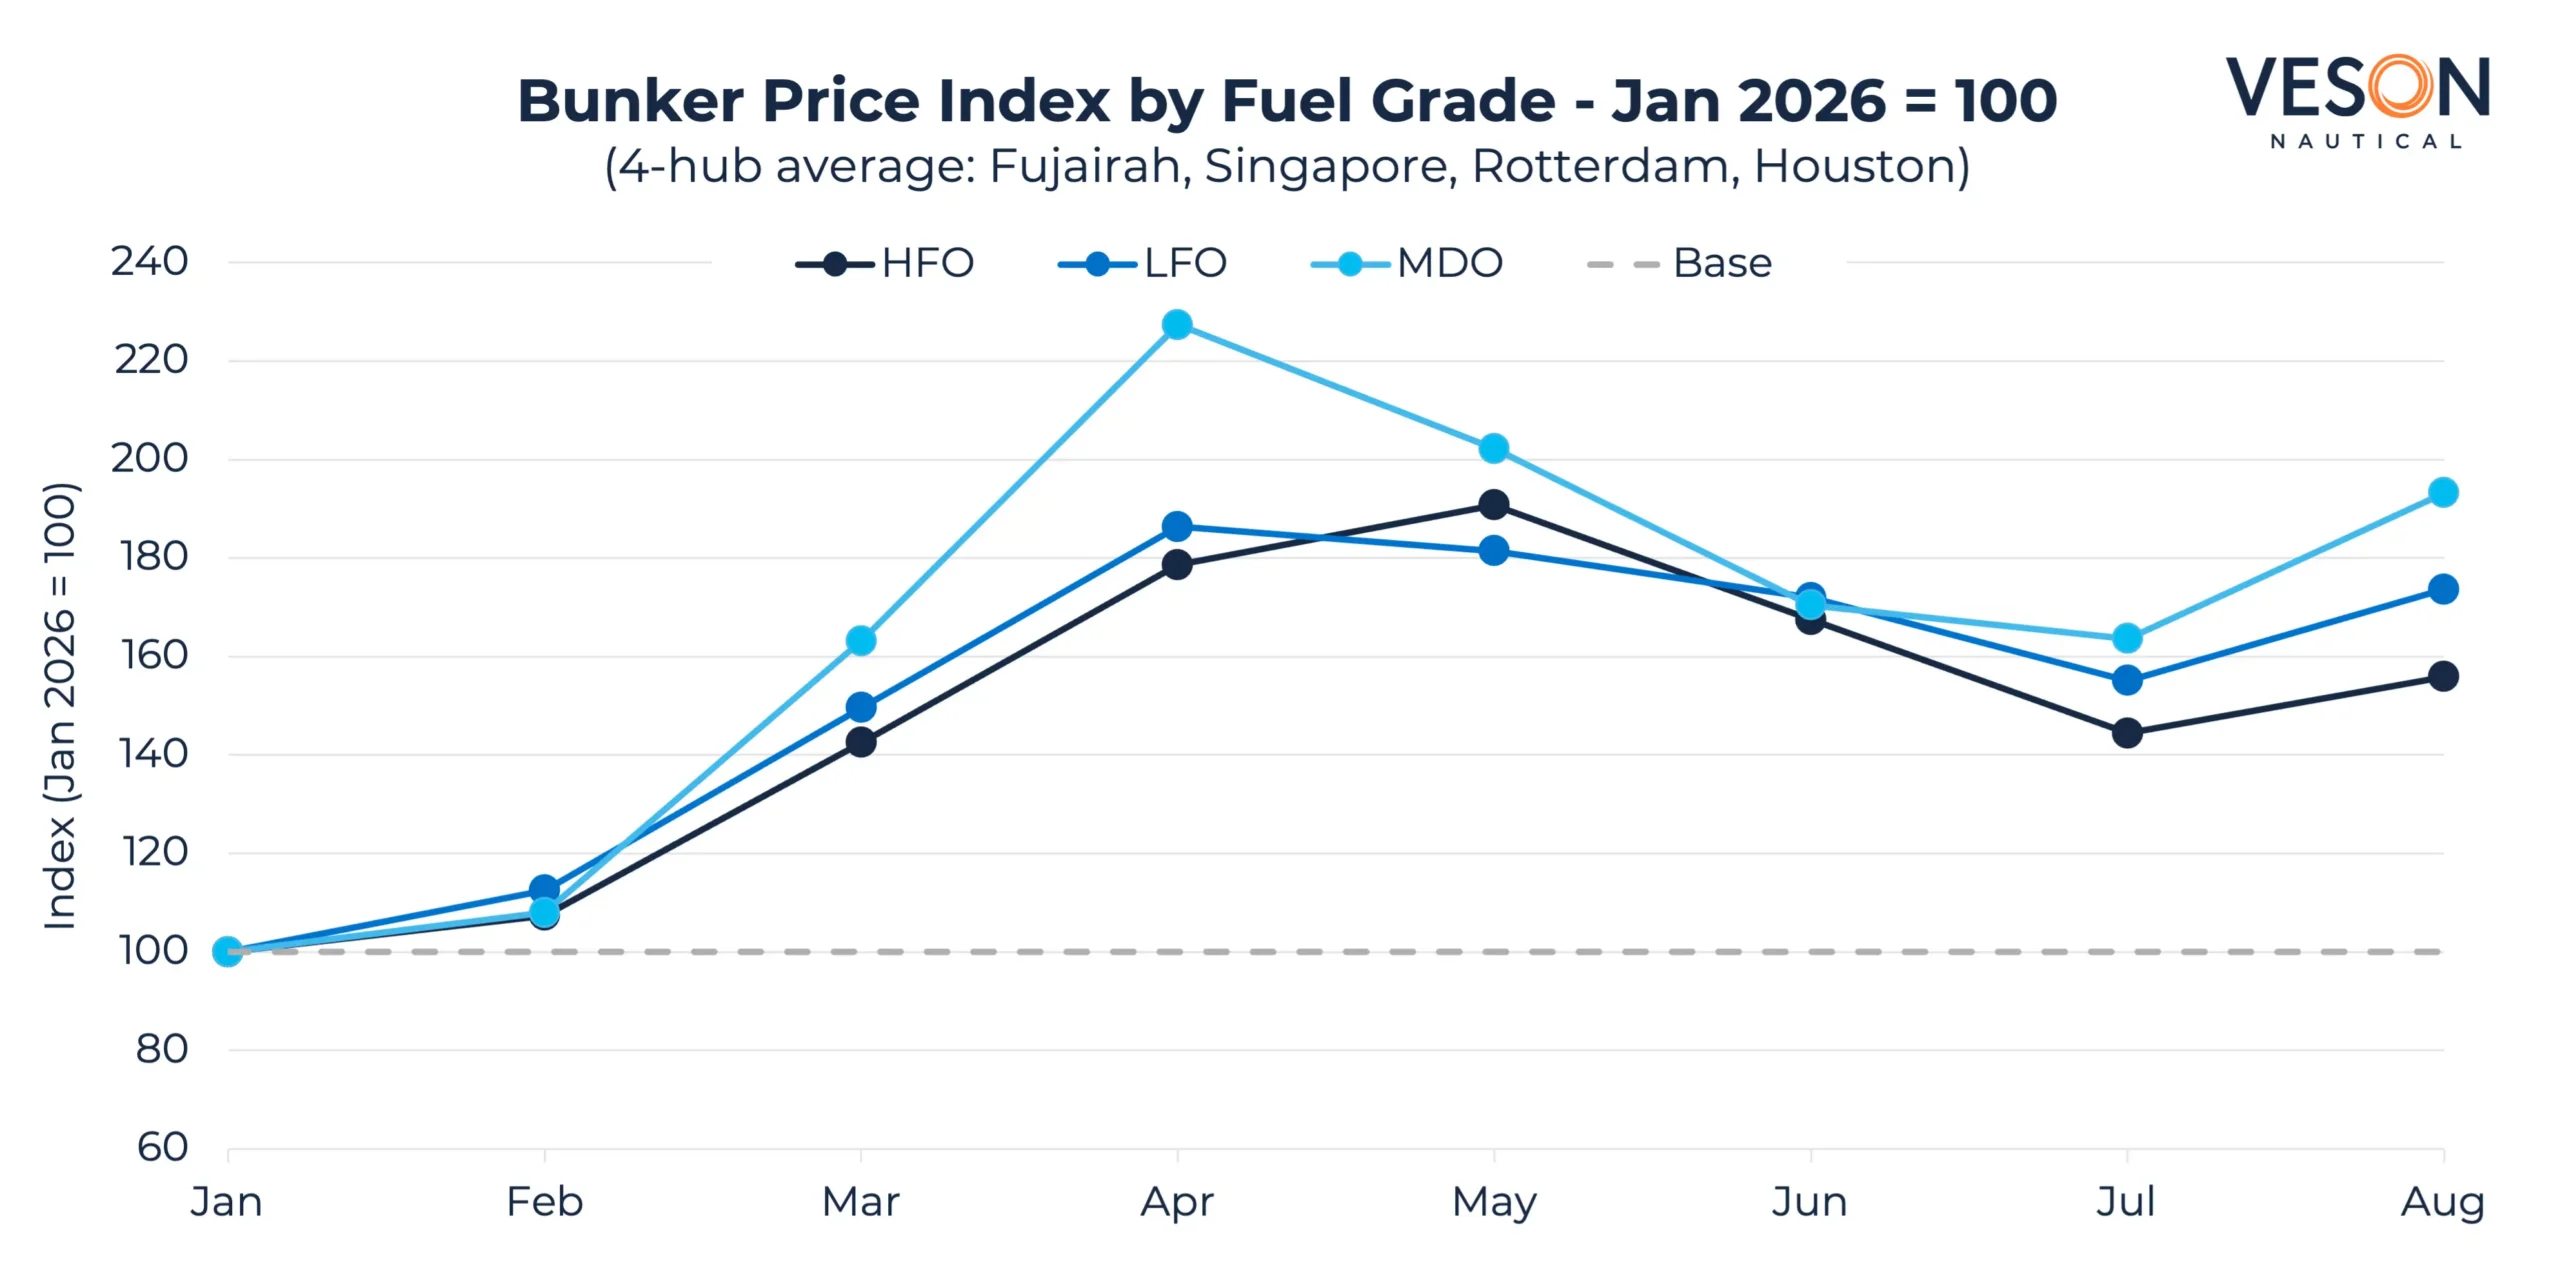
- HFO moved from $350-380/MT in January-February to a peak plateau of roughly $630-670/MT in April-May – about a 91% increase from the January baseline at its May peak, before easing back to $508/MT in July and $549/MT in August.
- LFO rose from ~$436-490/MT pre-conflict to ~$812/MT at its April peak, an increase of about 86%, with high-end estimates reaching ~$1,020/MT, before settling into a $675-790/MT range over the summer.
- MDO moved the most dramatically of the three: from a baseline of $650-710/MT to ~$1,500/MT at the height of the disruption in April – an increase of roughly 127%, with high-end estimates near $1,790/MT – easing to $1,070-1,270/MT through June-August.
Averaged across hubs, though, the fuel-grade comparison above hides a consistent pattern underneath: broken out port by port, Fujairah has shifted to being one of the more expensive major hubs across all fuel grades. The shift is consistent with Fujairah’s position closest to the mouth of the Strait of Hormuz.
What uncertainty reveals about pricing
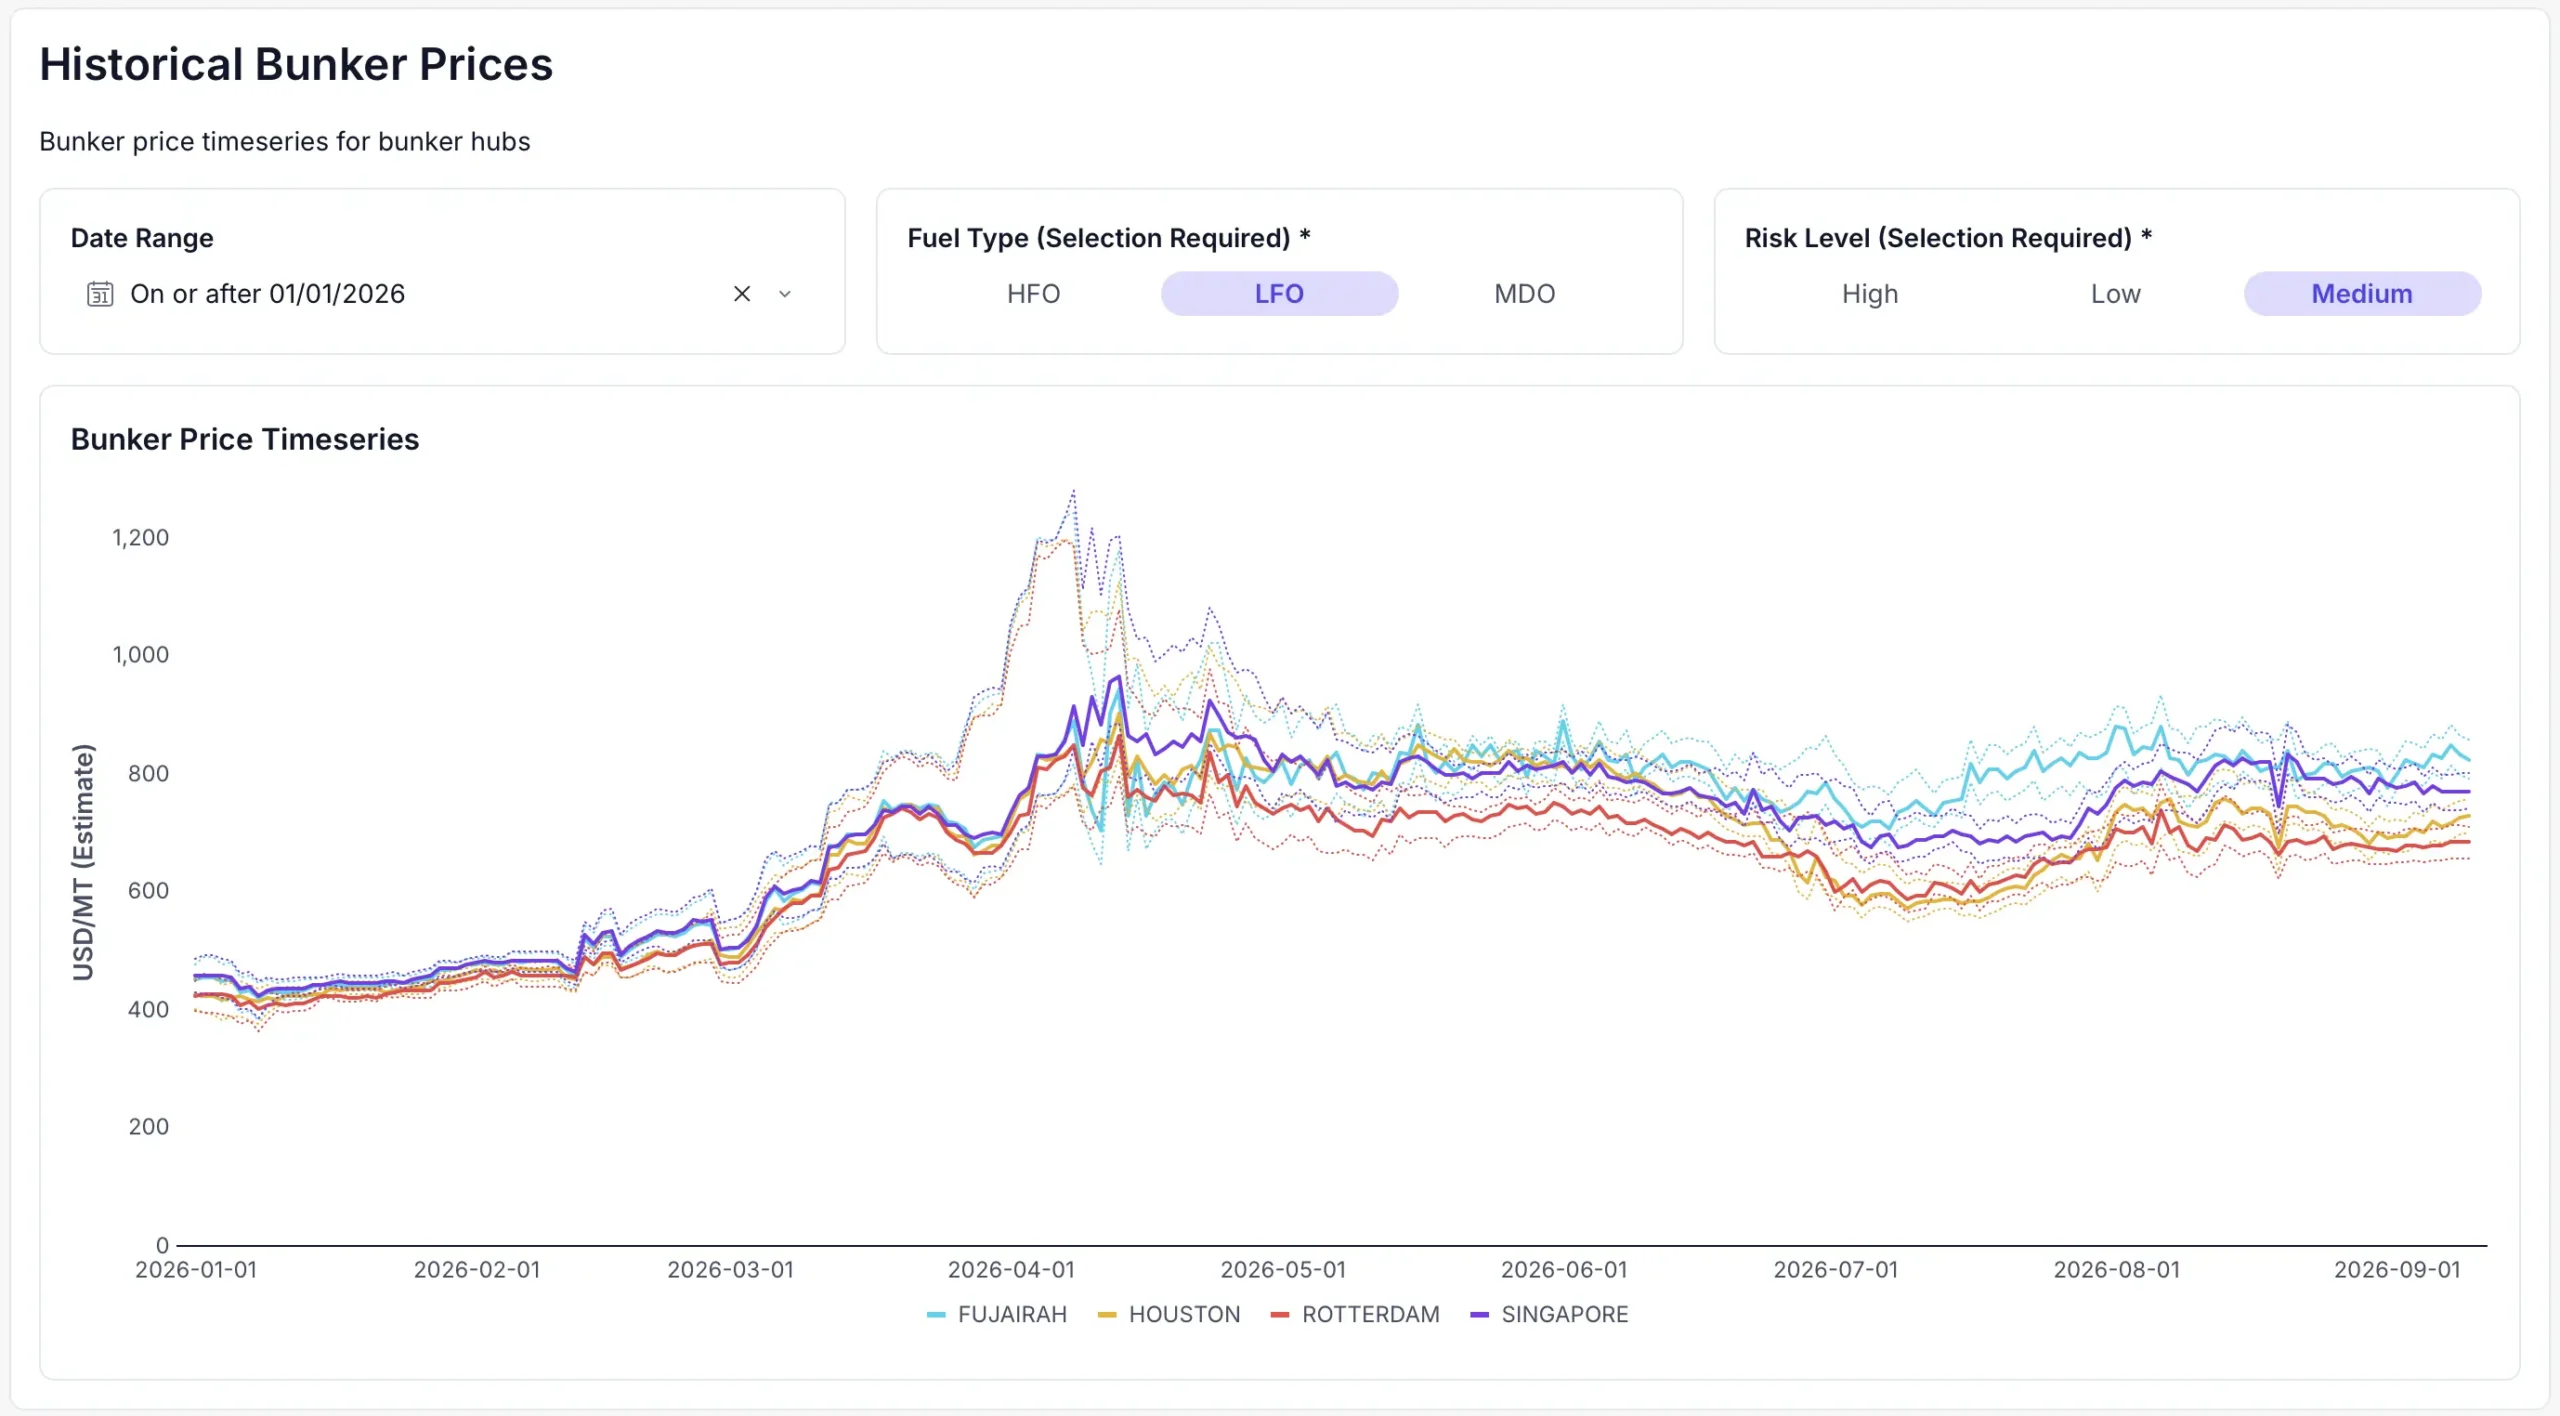
Extreme volatility widens the range of outcomes around any price estimate, and this variability shows up directly in the data: the confidence bands around each timeseries are visibly tighter in the calm January-February period than during the March-May spike.
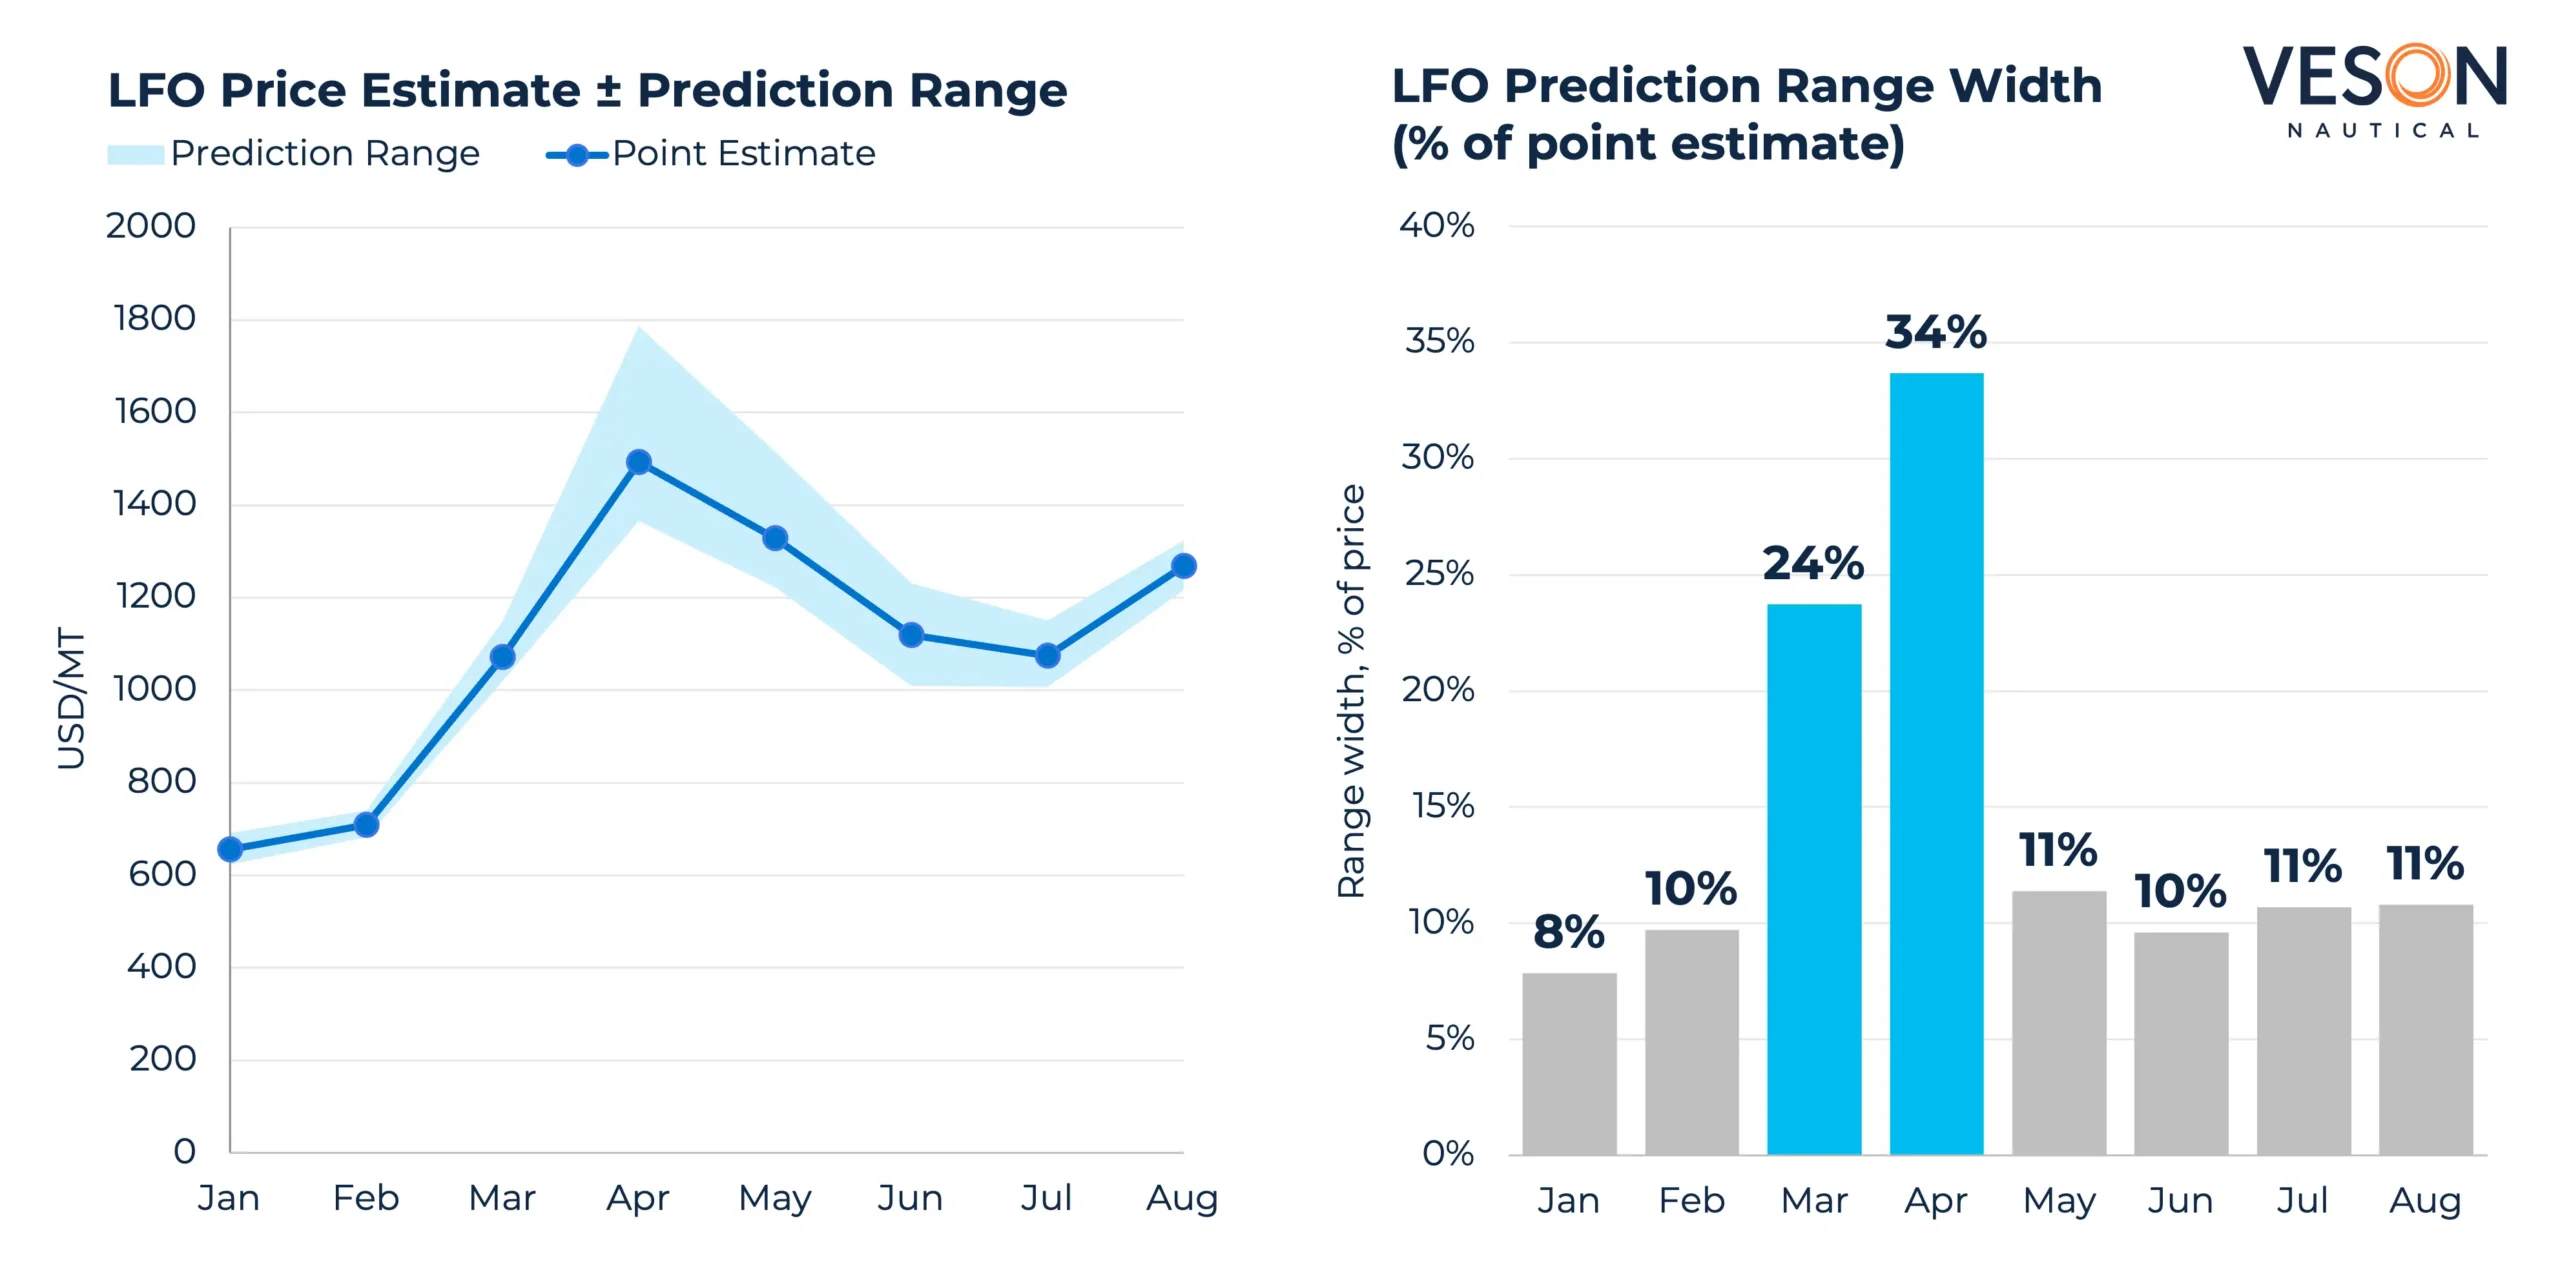
For LFO, the prediction range held to 8-10% of the point estimate through January-February, widening to 34% at the height of the disruption in April, before narrowing back to 10-11% as markets stabilised.
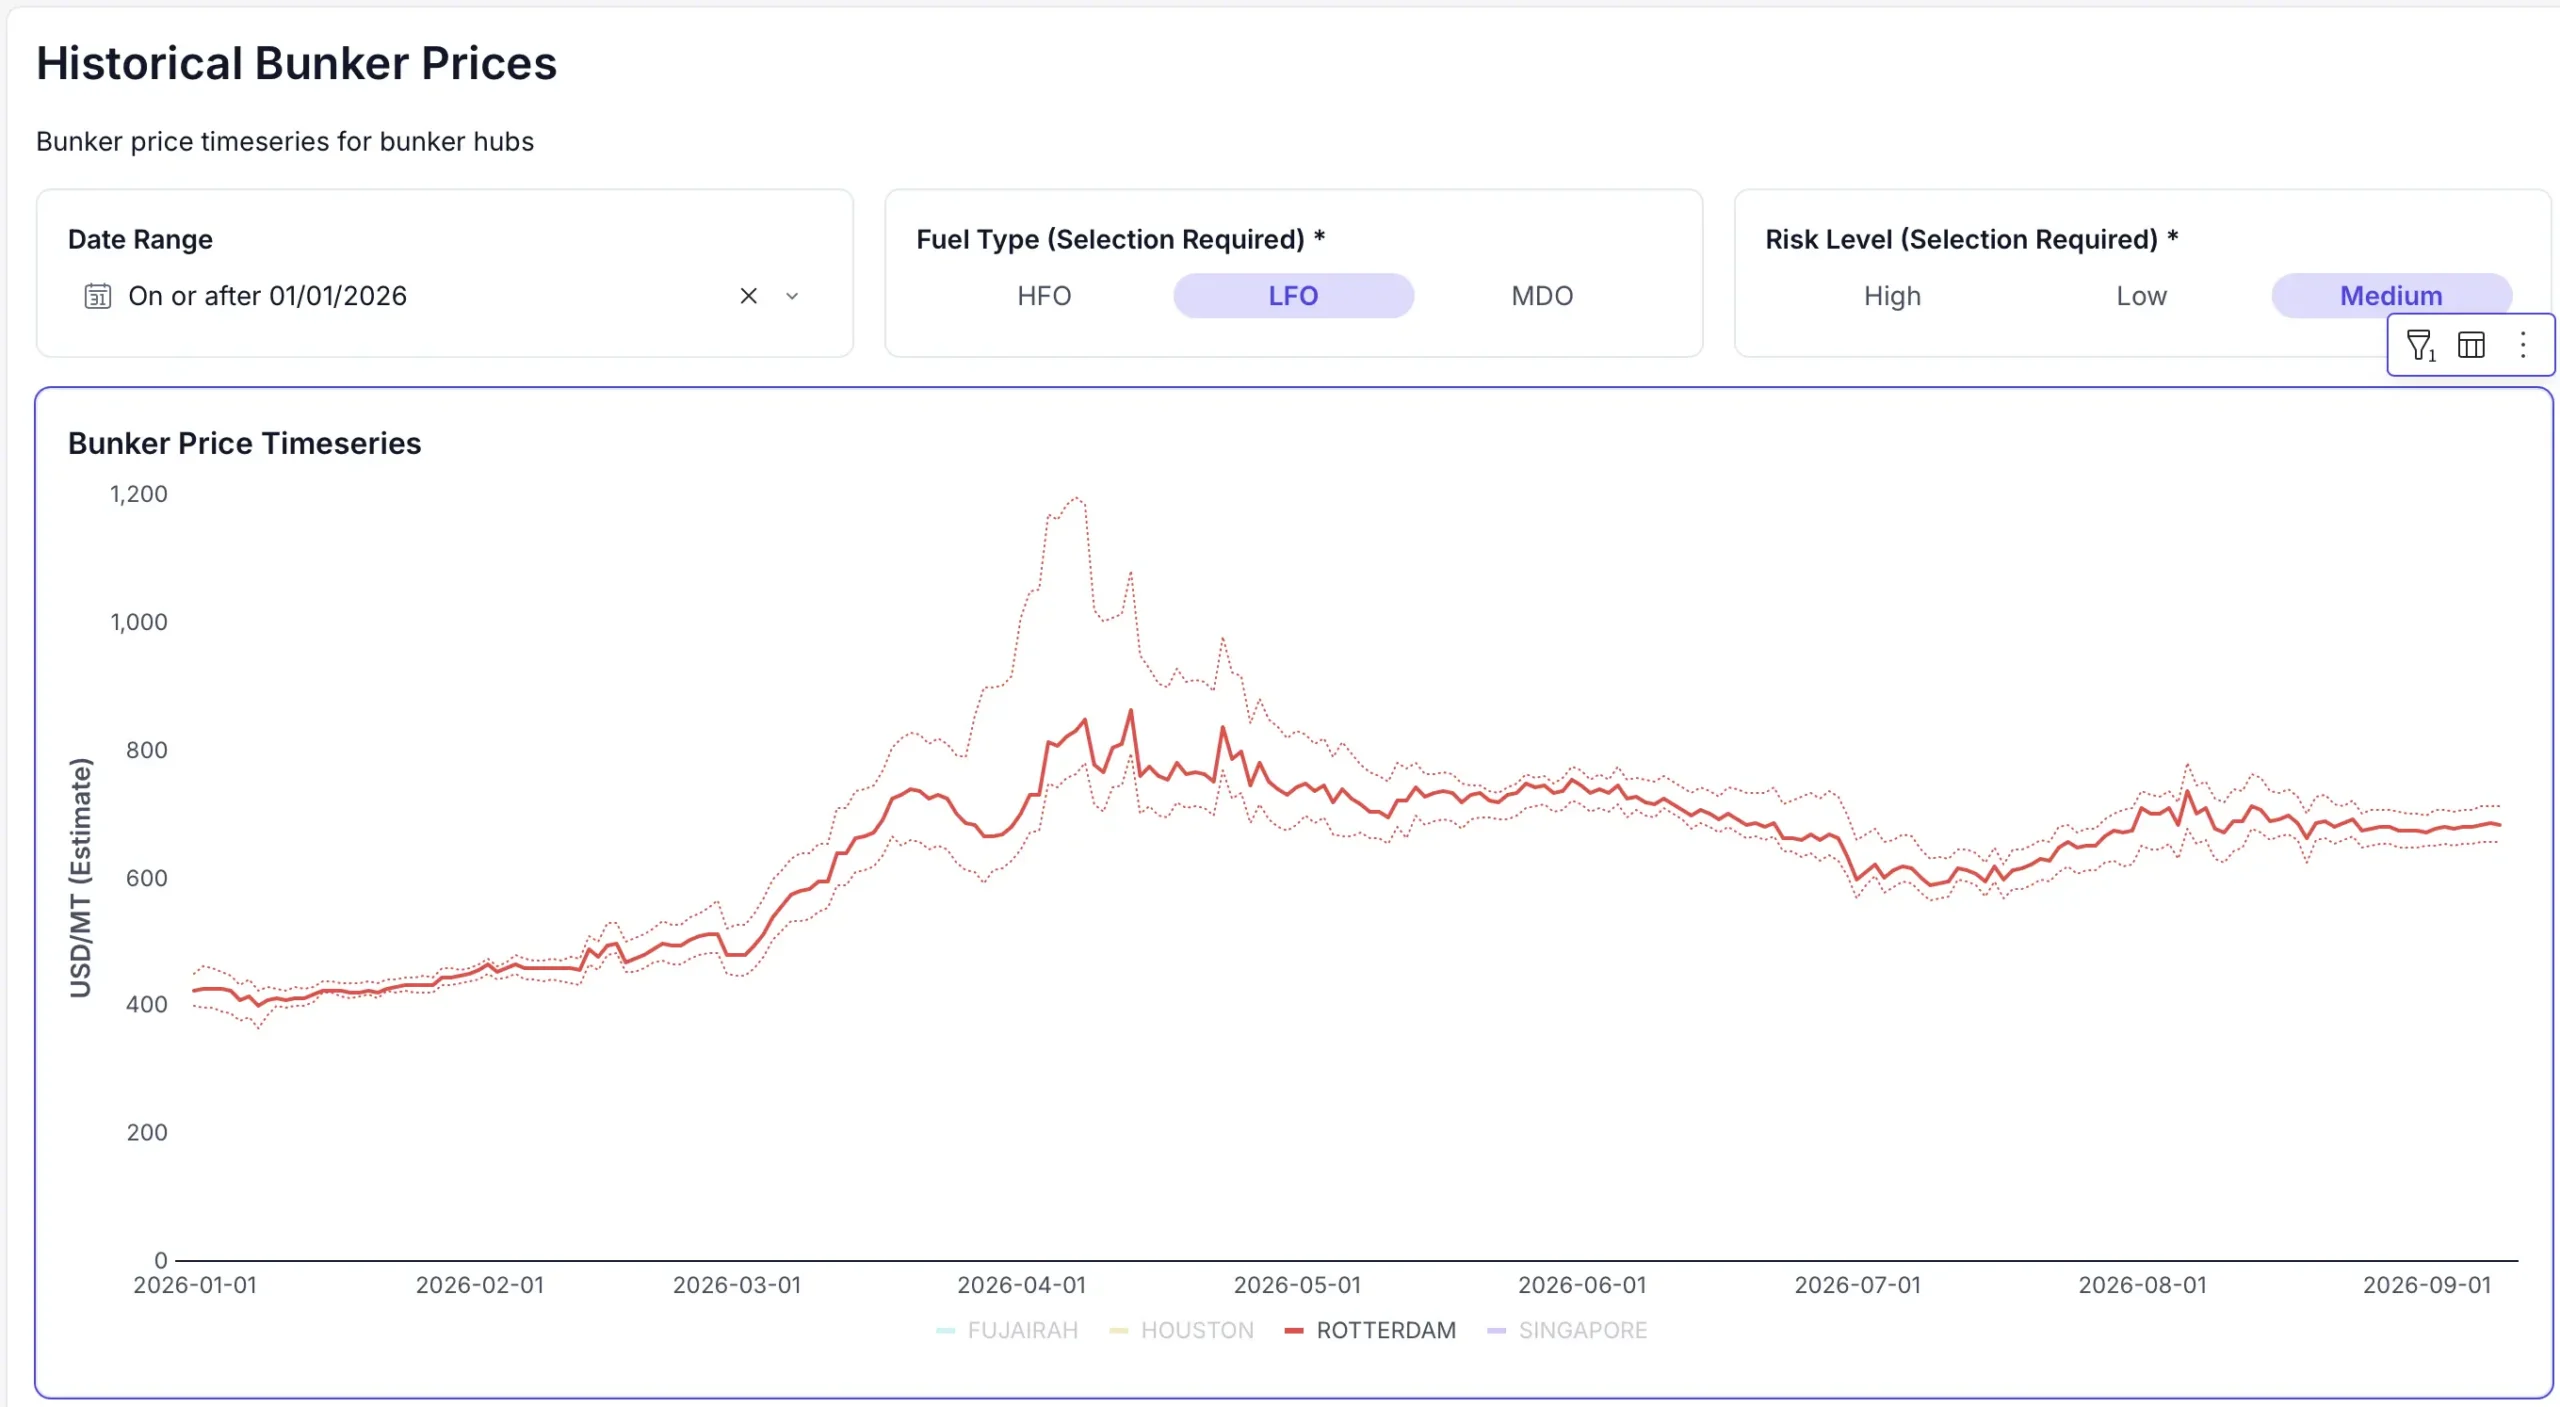
Daily data for Rotterdam LFO shows the same change over time, with peak uncertainty during April following the prices reaching their peak. This uncertainty demonstrates that the market has become far less predictable. Bunker Insights surfaces the uncertainty directly in the data, exposing when it’s confident and when it isn’t: tight ranges in calm markets and visibly wider ones when geopolitical shocks make any point prediction less certain.
For a procurement team, that width is strategic information. A narrow band says, “this price is a reasonable anchor for negotiation,” while a wide one is a signal to build in more contingency or seek additional quotes.
A disruption of this size is the environment in which port- and grade-level visibility has the most value, because the cost of getting port selection or timing wrong scales with it.
What this means for procurement planning
1. Not all hubs carry the same exposure. Fujairah, Singapore, Rotterdam, and Houston have not always moved together — Fujairah shifted to being one of the more expensive major hubs across all three fuel grades during the disruption. Port selection is of particular importance during a volatile market.
2. A retreat from peak prices isn’t the same as resolution. Prices eased from their April/May highs through the early summer, but each grade turned back upward in August. Treating a dip as the start of a return to normal could risk the timing of a procurement decision.
3. Wider uncertainty bands are a market signal. A fourfold widening in the LFO prediction range between the calmest and most volatile months this year shows where the market’s confidence is lowest and where additional diligence before committing to a stem pays off most.
Port-by-port, grade-by-grade data shows how this disruption has flowed through to bunker costs, and how it’s likely to evolve. Supply through the Strait of Hormuz remains constrained, so this level of unpredictability is likely to persist.
The hubs and grades covered here are only part of the picture for planning decisions being made. Bunker Insights extends this same visibility across 1,300+ ports for day-to-day and future pricing, with deeper scenario modelling available for a global port database and hypothetical crude pricing and quantity levels.
Request a demo to see how Bunker Insights can bring your team a more accurate, forward-looking market view that helps you make smarter decisions.
CME Group market data is used under license as a source of information for certain Veson Nautical LLC (Veson) products. CME Group has no other connection to Veson products and services and does not sponsor, endorse, recommend or promote any Veson products or services. CME Group has no obligation or liability in connection with the Veson products and services. CME Group does not guarantee the accuracy and/or the completeness of any market data licensed to Veson and shall not have any liability for any errors, omissions, or interruptions therein. There are no third-party beneficiaries of any agreements or arrangements between CME Group and Veson.
WEBINAR