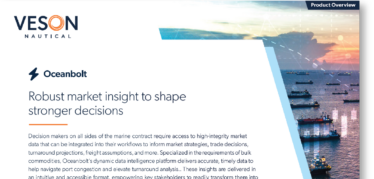
High-quality market intelligence for powerful decision-making
With Oceanbolt, you can integrate high-integrity market data into your workflows, giving you the power to inform your market strategies, trade decisions, turnaround projections, freight assumptions, and more. Specialized in the requirements of bulk commodities, Oceanbolt’s dynamic data intelligence platform delivers accurate, timely data to help navigate port congestion and elevate turnaround analysis.
23K+
vessels tracked in real time
9B+
tons of cargo tracked annually
170
commodities covered
Unleash the power of Oceanbolt’s maritime market intelligence in your organization today
Strengthen decisions with market data
Real-time and historical insights on commodity trade flows, freight tonnage flows, vessel positions, port congestion, and turnaround times.
Make advanced calculations in seconds
Real-time and historical insights on commodity trade flows, freight tonnage flows, vessel positions, port congestion, and turnaround times.
Leverage pre-configured dashboards
Up-to-date analyses on supply and demand for specific commodity types and grades in different regions of the world.
Power custom insights with Oceanbolt
Flexible API to integrate Oceanbolt data in a way that supports your unique business initiatives and competitive strategies.
“We were immediately impressed by the vision of the Oceanbolt platform and the team’s focus on API-first development. We had a requirement to build a machine learning-based market model and, after thorough evaluation…, Oceanbolt stood out as an emerging leader in the dry bulk space so we decided to go with them.”
William Eduard | Global Head of Research

“[Oceanbolt] offers three advantages. The first one is the quality of the data. The AIS data is extremely accurately linked to commodity data. The second one is API integration, or the connection between applications for sharing some functions. This makes it easy to integrate Oceanbolt’s services with other systems. The third advantage is the solid after-sales service.”
Kohei Morita | Drybulk Planning Group Project Team Lead

“One element of our DX strategy is to promote the use of external data sources. [Oceanbolt] is one successful example of reducing data processing time and introducing a system for real-time data analysis and sharing by linking Oceanbolt data to BI tools through API. Using Oceanbolt’s services, we can read signs of change in recent vessel movements and cargo movements. It can be used to provide information to customers besides internal stakeholders.”
Kanoko Ogino | Drybulk Planning Group Project Team Member

What can you do with Oceanbolt data?
- For Charterer
- For Operator
- For Physical Trader
- For Professional Services
Make more profitable decisions
Harness real-time and historical trade data to pinpoint and capitalize on peak demand periods and regions. Assess market fluctuations with trend analysis and ensure your vessels are at the right place at the right time.
Stay ahead with dynamic commodity insights
Track shifts in global commodity supply and demand. Leverage real-time data to adjust chartering strategies on-the-fly and capture the best possible rates in rapidly changing markets.
Eliminate costly port waiting times
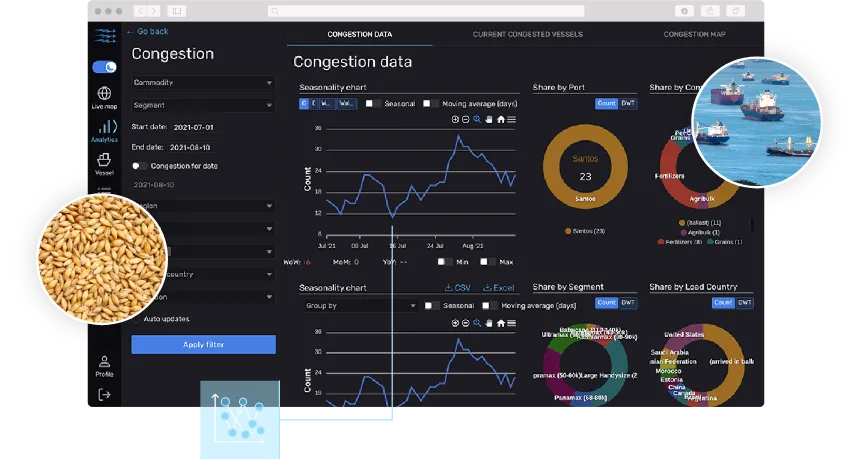
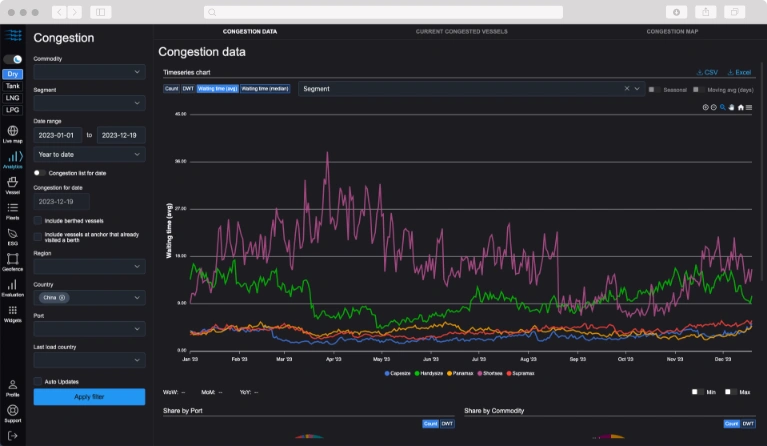
Dive into port congestion data and historical trends to ensure optimal routing and timing for your chartered vessels, minimizing delays and demurrage costs.
Operate fleets seamlessly
Utilize real-time and historical vessel tonnage data to optimize fleet deployment and operations. Anticipate demand patterns to ensure vessels are prepared to meet operational challenges.
Minimize port delays
Harness port congestion data to understand and predict peak congestion periods. Schedule voyages to avoid these periods to enable faster berthing and reduced turnaround times.
Optimize voyage routes
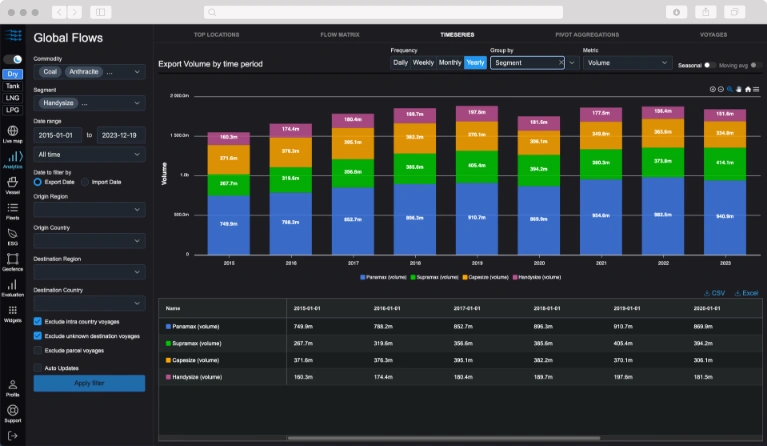
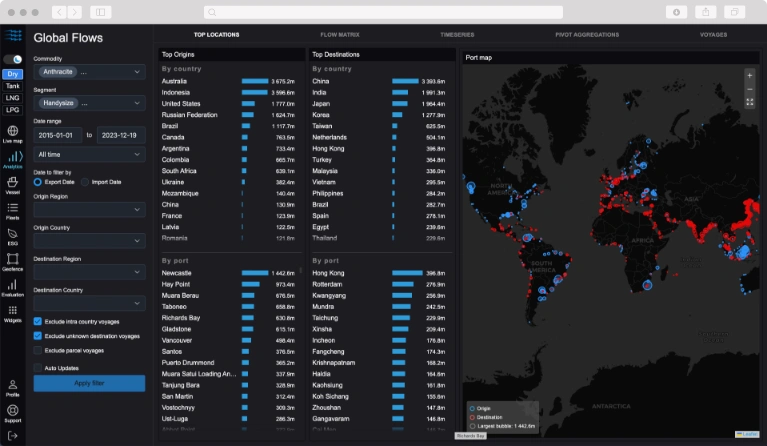
Access trade flow data to identify high-demand routes and commodities. Plan voyages to align with these trends, maximize operational efficiency, and reduce idle times.
Make better trades
Embrace the power of real-time and historical trade data to identify market trends and shifts. Use this intelligence to anticipate price movements, secure favorable deals, and capitalize on emerging opportunities.
Adapt your strategies to the market
Monitor global shifts in commodity supply and demand. Adjust your trading strategies based on real-time data, ensuring you’re always one step ahead of the market and positioning your organization to capture the best possible margins.
Streamline logistics and contain costs
Utilize port congestion data and historical trends to enhance operations, accelerate deal turnovers, and enhance your bottom line. Ensure efficient routing and timing, minimize logistical bottlenecks, and contain costly demurrage.
Make precise decisions with precise data
Enrich your analyses with real-time and historical trade data. Whether you’re a paper trader evaluating potential positions or a financial analyst forecasting market movements, ground every decision in high-integrity data.
Keep up with changing market dynamics
Understand intricate market dynamics by tracking global shifts in commodity supply and demand. Capture the complete picture to enhance your strategies and fortify your organization’s competitive edge.
Sharpen your projections
Inform custom analyses and projections with trend data, port congestion insight, and trade flow metrics. Anticipate market changes and challenges, strategizing for the future with confidence.
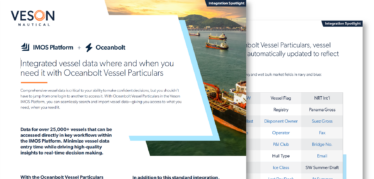


Put Oceanbolt data in context
High-integrity data is powerful, but putting that data in context is transformative. That’s why we’re harnessing Oceanbolt data to power IMOS in exciting new ways.
Schedule your Oceanbolt demo
Frequently asked questions on Oceanbolt
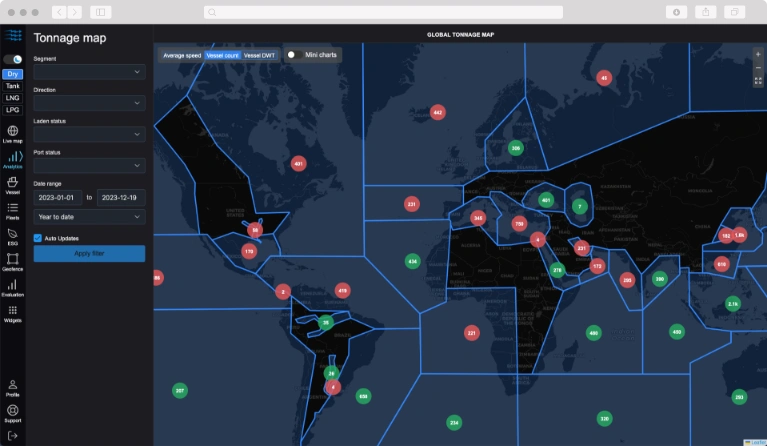
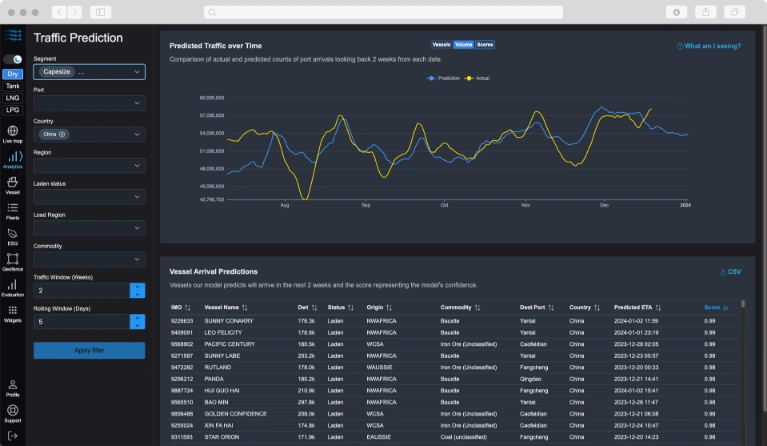
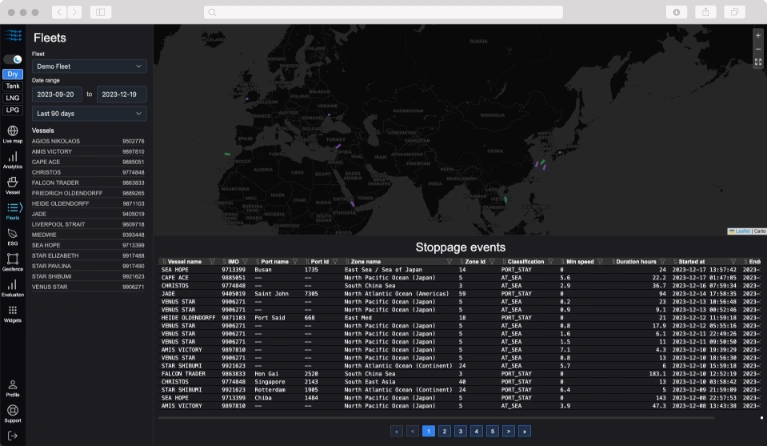
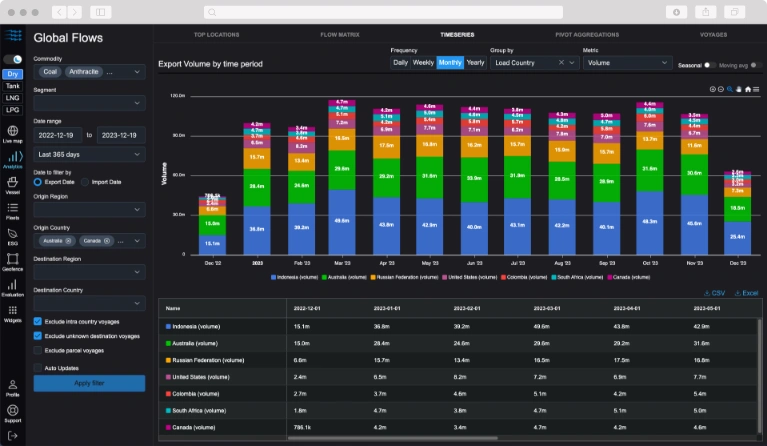
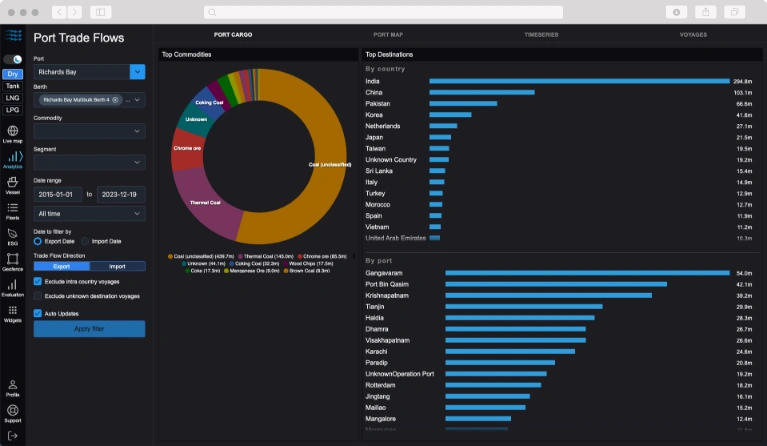
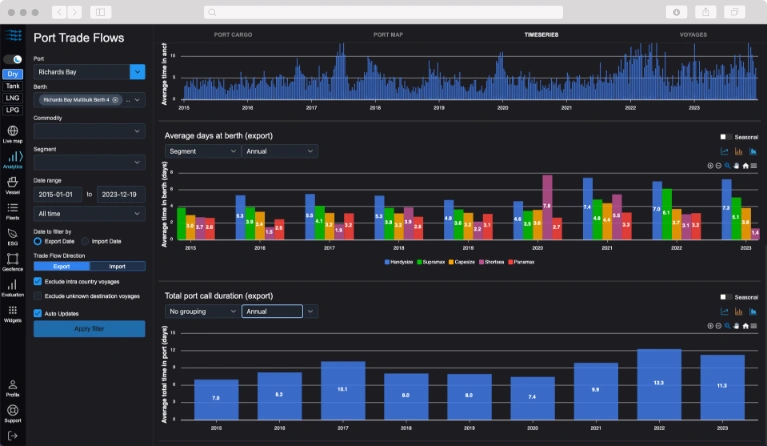
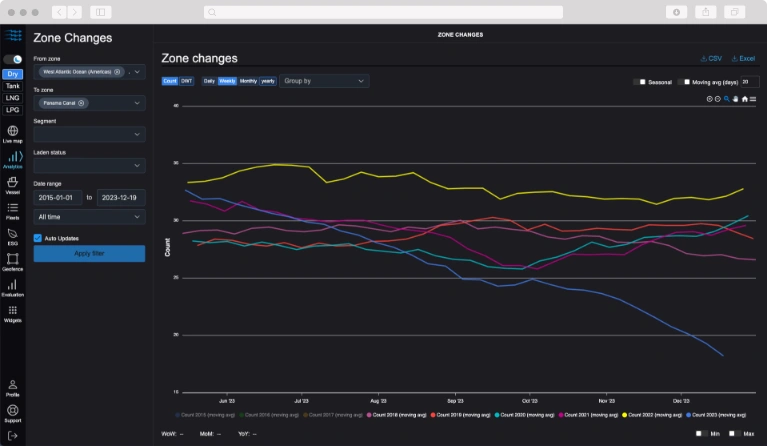
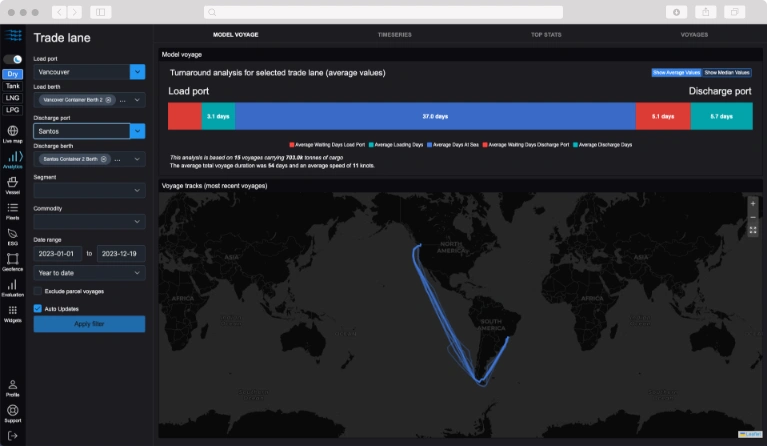
Oceanbolt is a maritime market intelligence solution that delivers real-time and historical data on commodity trade flows, vessel movements, port congestion, and freight activity. Tracking 23,000+ vessels and 9+ billion tons of cargo annually across 170 commodities, Oceanbolt helps shipping and commodity trading organizations analyze global trade patterns and make data-driven commercial decisions.
Shipping and commodity markets generate enormous volumes of fragmented data across disparate sources. Oceanbolt aggregates and structures data from AIS vessel tracking, trade flows, and port activity — processing billions of data points and making millions of daily observations — to provide clear, actionable insights into supply-demand trends, vessel availability, and real-time market movements.
Oceanbolt provides global commodity trade flows across 170 commodities, freight tonnage flows, real-time vessel positions for 23,000+ vessels, port congestion analytics, and turnaround time data. Pre-configured dashboards deliver up-to-date supply and demand analysis by commodity type and region. Data is accessible via web dashboard, flexible API, Python and R SDKs, and Excel Add-in.
Oceanbolt delivers real-time insights into vessel activity, tonnage flows, and port congestion, enabling organizations to quickly adjust chartering and trading strategies as market conditions evolve. With real-time and historical trade data, teams can identify peak demand periods and regions, anticipate price movements, and capitalize on emerging opportunities — ensuring vessels are in the right place at the right time.
Oceanbolt analyzes historical and real-time port activity, vessel movements, and congestion trends across thousands of berths worldwide to help organizations estimate waiting times and plan voyages more efficiently. By identifying peak congestion periods and historical turnaround patterns, teams can optimize routing and timing for chartered vessels — minimizing delays and containing costly demurrage.
Oceanbolt aggregates historical and real-time data on commodity movements and vessel activity to reveal shifts in global trade flows. Users can analyze routes, cargo volumes, and vessel deployment patterns to identify emerging trade corridors, anticipate demand shifts, and adjust trading strategies proactively — all backed by 9+ billion tons of cargo tracked annually across 170 commodity types.
Yes. Oceanbolt integrates with internal analytics tools and enterprise systems via flexible API, Python SDK, R SDK, and Excel Add-in. Organizations can seamlessly incorporate Oceanbolt’s market intelligence into existing BI tools, databases, data warehouses, and commercial workflows — enabling custom analysis and automated data pipelines that enhance trading and chartering decisions.
Oceanbolt is used by dry bulk shipowners and operators, charterers, commodity trading houses, supply chain and logistics teams, and market analysts worldwide. Organizations like K-Line and other leading maritime companies rely on Oceanbolt to enrich their market analysis — importing data into BI tools through flexible APIs for real-time visualization, custom modeling, and data-driven decision support.