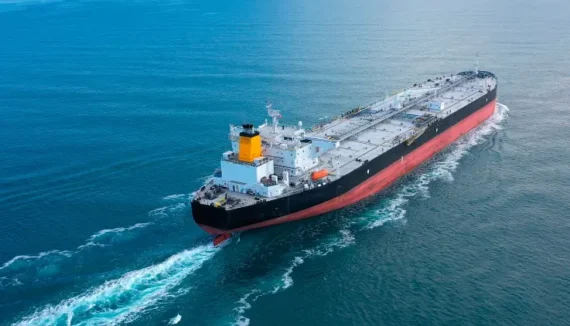

As we enter this next quarter, shipping markets are navigating a pivotal geopolitical inflection point. The Islamabad MOU signed on 17 June marks a tentative de-escalation of the Iran conflict, with the Hormuz Strait transits gradually resuming, but full normalisation is not expected before year-end. The prolonged closure has reshaped trade patterns across all sectors, introducing both short-term distortions and longer-term structural questions. Separately, the continued absence of a return to Suez Canal transits keeps voyage distances elevated for Vehicle Carriers and Containers, a dynamic expected to reverse from 2028.
Tanker markets have shown remarkable strength well above what the volume loss would normally imply, driven by repositioning inefficiencies and longer Atlantic distances. Bulkers remain firm on strong Chinese commodity demand, though supply growth will begin to outpace demand from 2027. Container markets face a worsening supply overhang as the orderbook approaches 40% of fleet, while the LPG market is experiencing severe disruption with Middle East export volumes forecast to fall 48% in 2026. Vehicle Carriers have also outperformed, with PCTC rates up sharply on strong Chinese vehicle exports, though a return to shorter Suez transits from 2028 threatens to unwind the current tight supply-demand balance.
Across all five markets, the interplay between recovering Middle East volumes, persistent Red Sea diversions, a surging newbuilding orderbook, and China’s structural economic transition will define the trajectory through 2029.
Tankers
- Q2 VLCC spot earnings averaged around 140,000 USD/day despite the Hormuz closure; MR product Tankers averaged around 40,000 USD/day, with vessel repositioning inefficiencies providing unexpected support above what volume losses would normally imply.
- Hormuz flows are expected to gradually resume from Q3 2026; full normalisation is unlikely by year-end, with uncertainty around production facility damage, well restart timelines, and global oil inventories drawing at 4–5 mbd, requiring replenishment.
- UAE and Iranian production increases alongside pent-up oil demand and global inventory restocking point to solid seaborne Tanker demand into 2027, with commercial and strategic stock rebuilding adding further support.
- Ordering has surged: 126 VLCCs contracted in Q1 2026 alone vs. 82 for all of 2025, pushing the orderbook-to-fleet ratio past 30%; effective fleet growth remains negative due to idled vessels around the strait but will increase considerably once MEG flows improve.
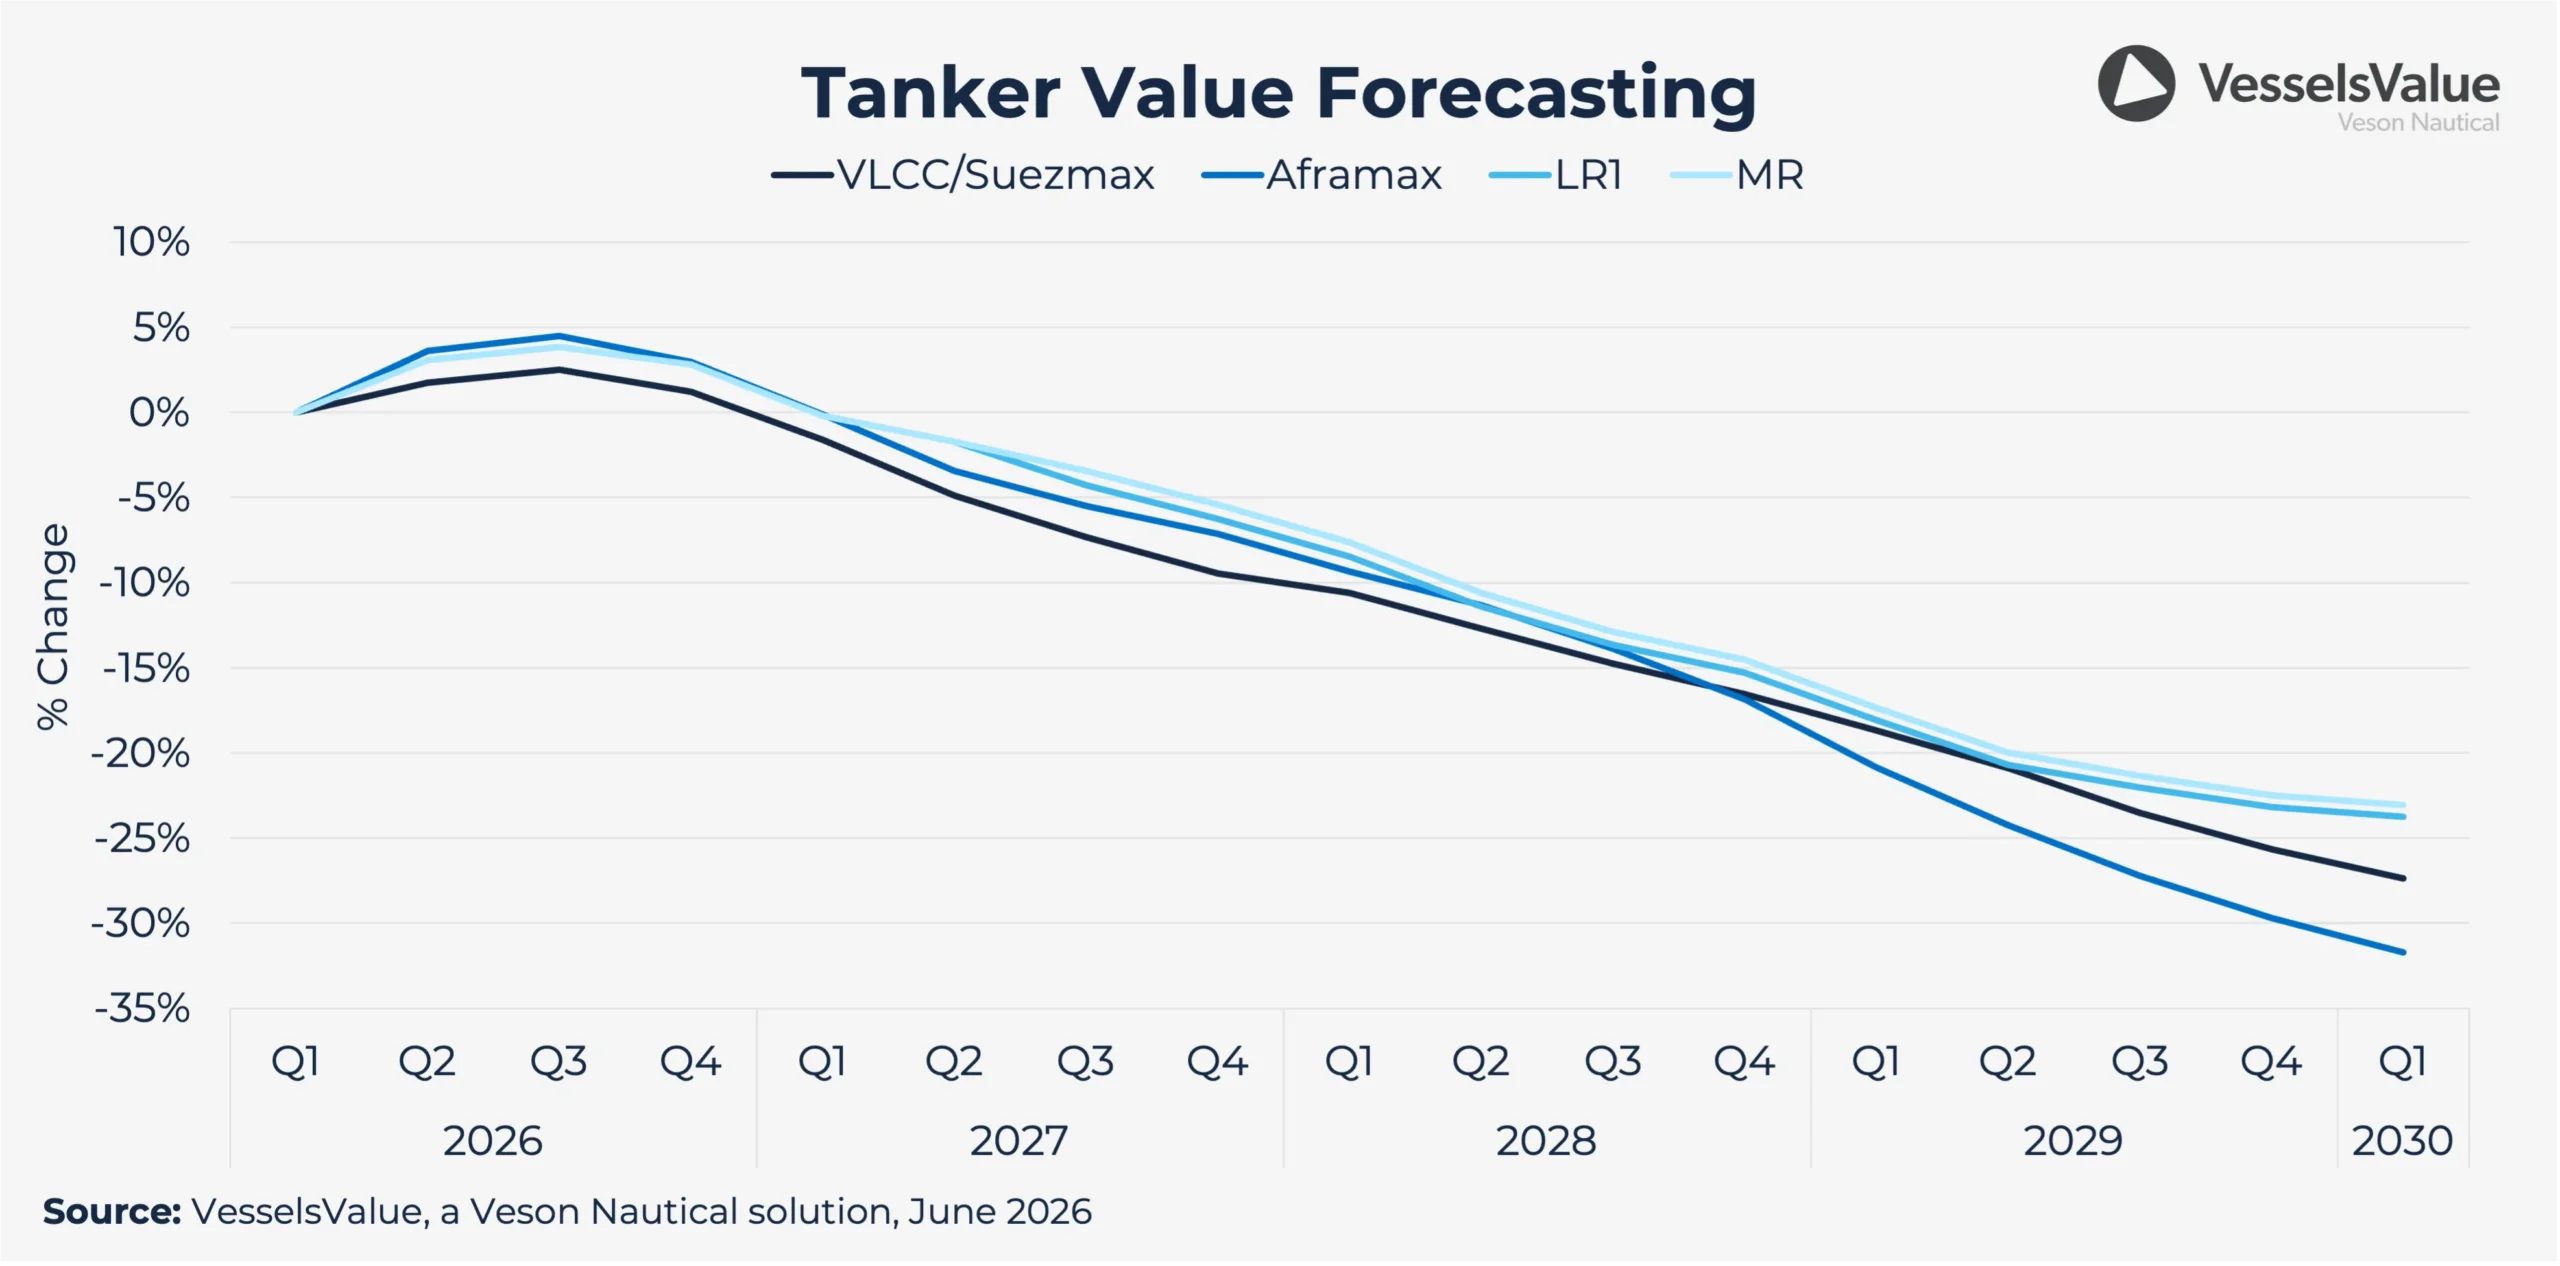
- From 2027, supply growth is expected to marginally outpace demand, widening thereafter; five-year-old VLCC values up 30% YTD and newbuilding prices up 4% as asset sentiment remains strong despite ordering expected to cool from recent highs.
Bulkers
- Capesize earnings averaged around 35,000 USD/day in Q2. double Q2 2025; Panamax at around 20,000 USD/day, up from around 10,000 USD/day, driven by strong Chinese demand for bauxite and iron ore sourced from the Atlantic.
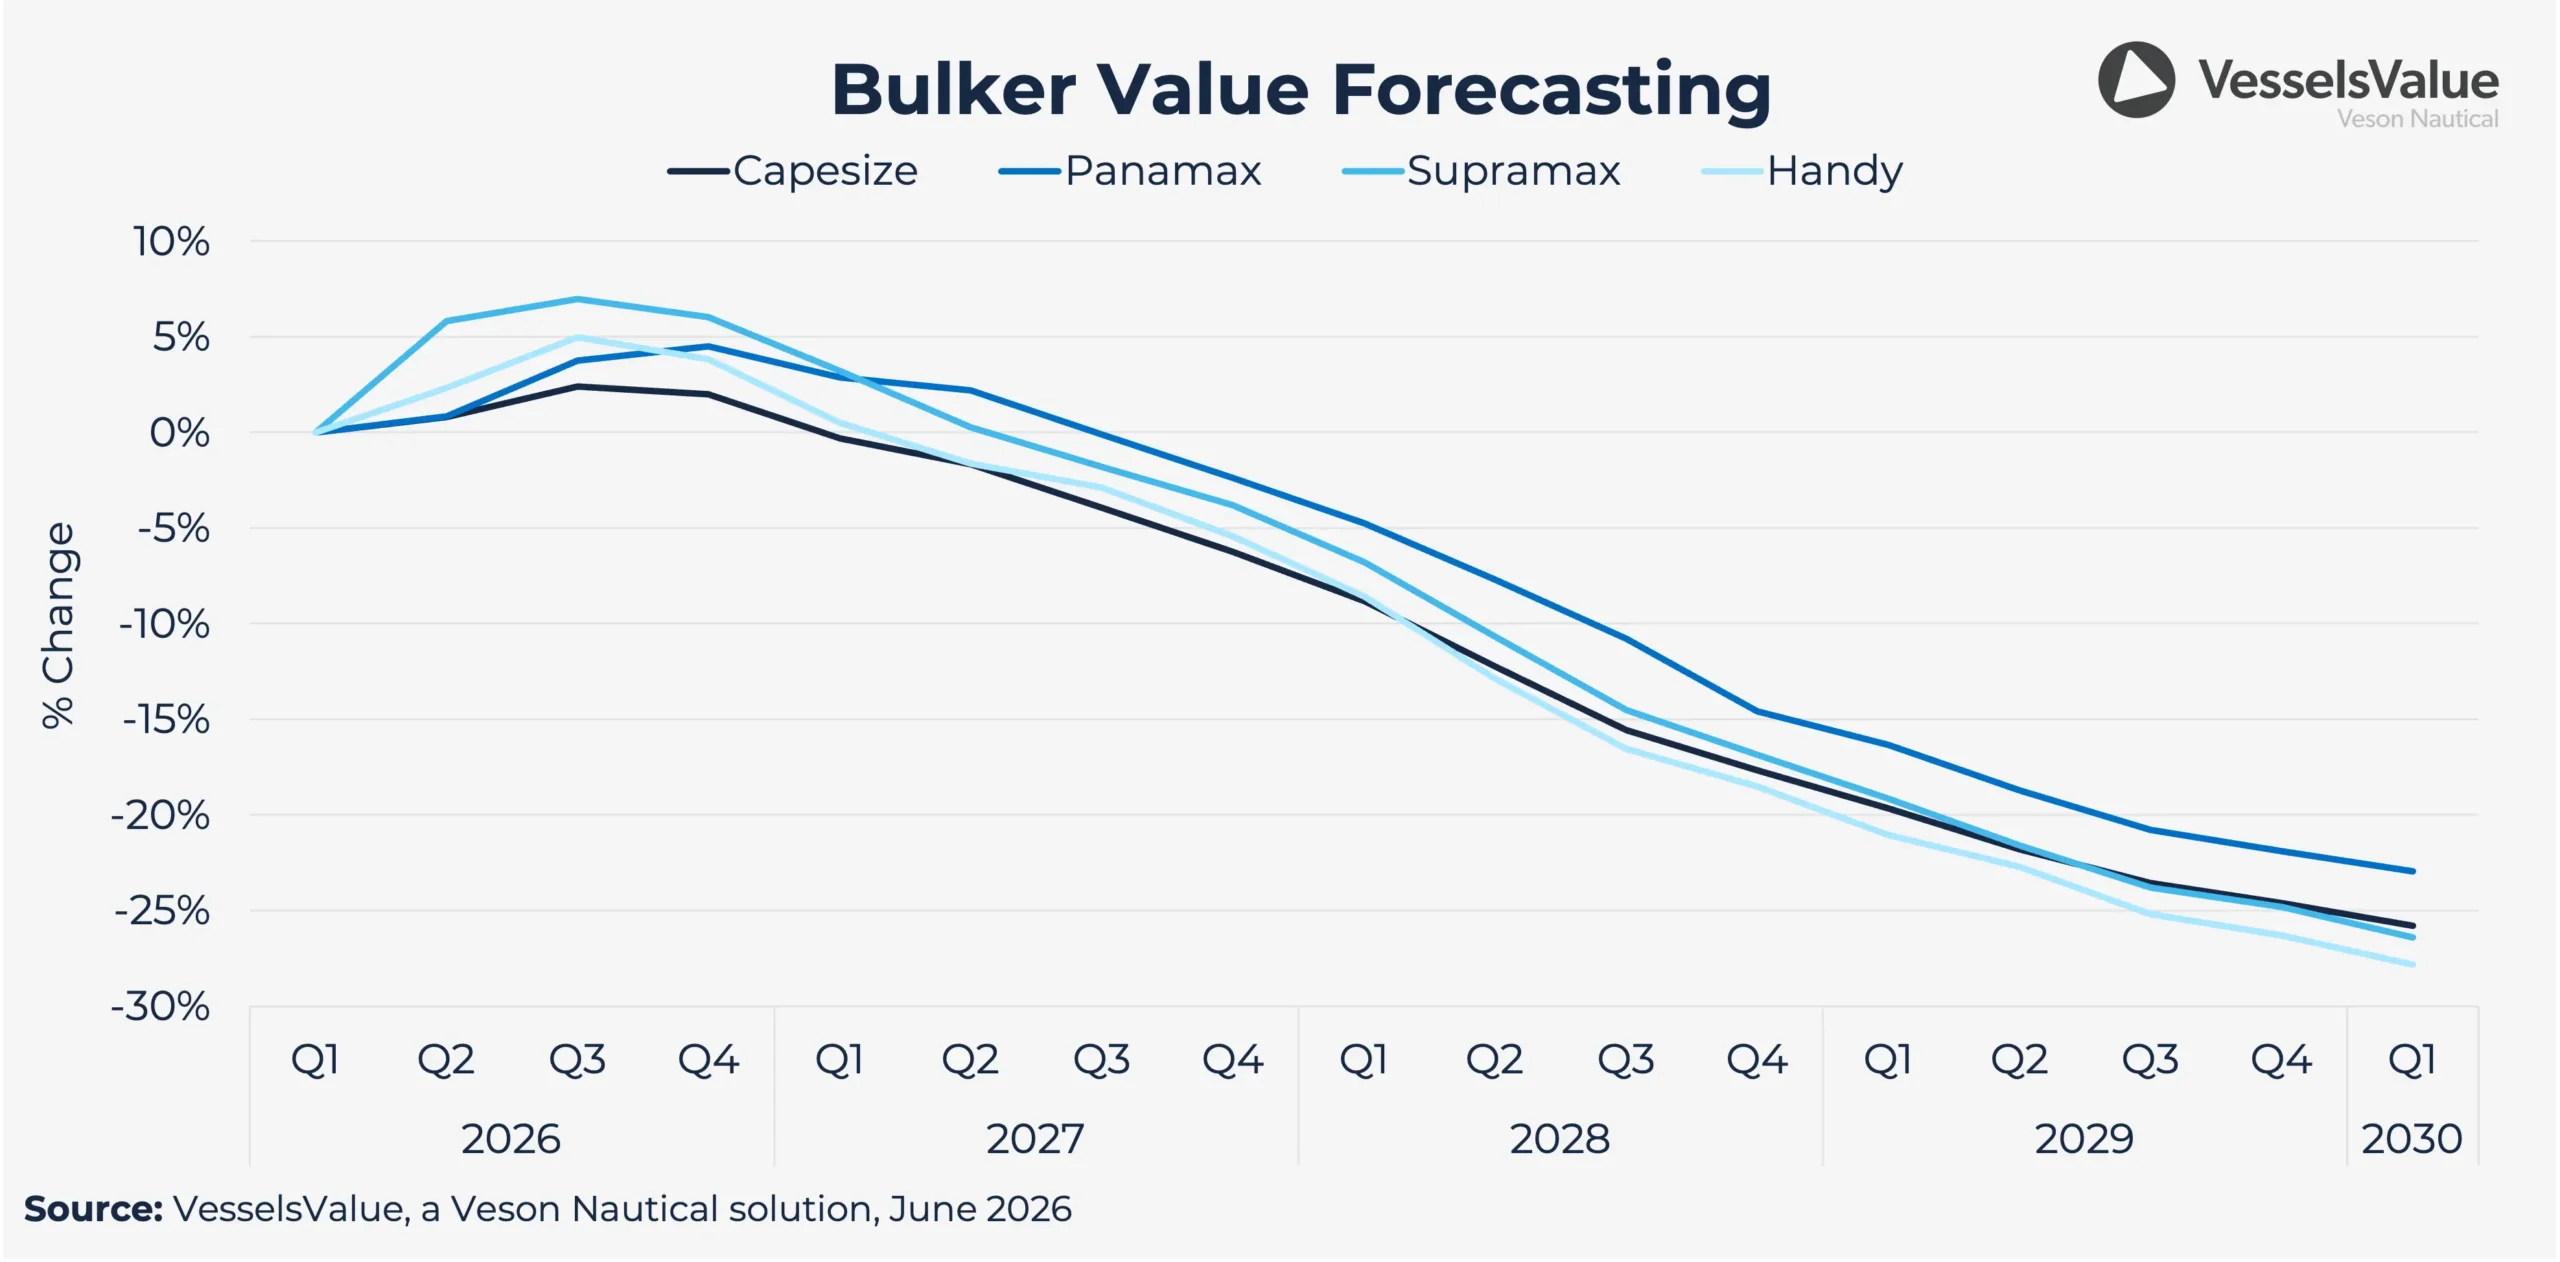
- Demand growth of approximately 2.3% per year is forecast through 2029, outpaced by fleet supply growth of approximately 3.3%, pointing to progressive downward rate pressure from late 2027 as the orderbook delivers.
- The Simandou’s ramp-up will add ton-miles as long-haul Guinea–China iron ore displaces shorter-haul Australian supply, providing structural demand support even as Chinese steel output softens from real estate sector weakness.
- The green transition is driving minor bulk demand up approximately 3.3% per year; Chinese bauxite imports reached approximately 200 Mt in 2025, up 15% YoY, with the majority from Guinea, generating durable long-haul Bulker demand.
- Net fleet growth is expected to average approximately 3.8% per year (2026–2029); with 42% of the fleet aged 10–15 years, a moderate scrapping pickup alongside rising maintenance inefficiencies is expected toward period-end.
Download the 2026 Mid-Year Shipping Market Report for a look back at how the markets have shifted.
Containers
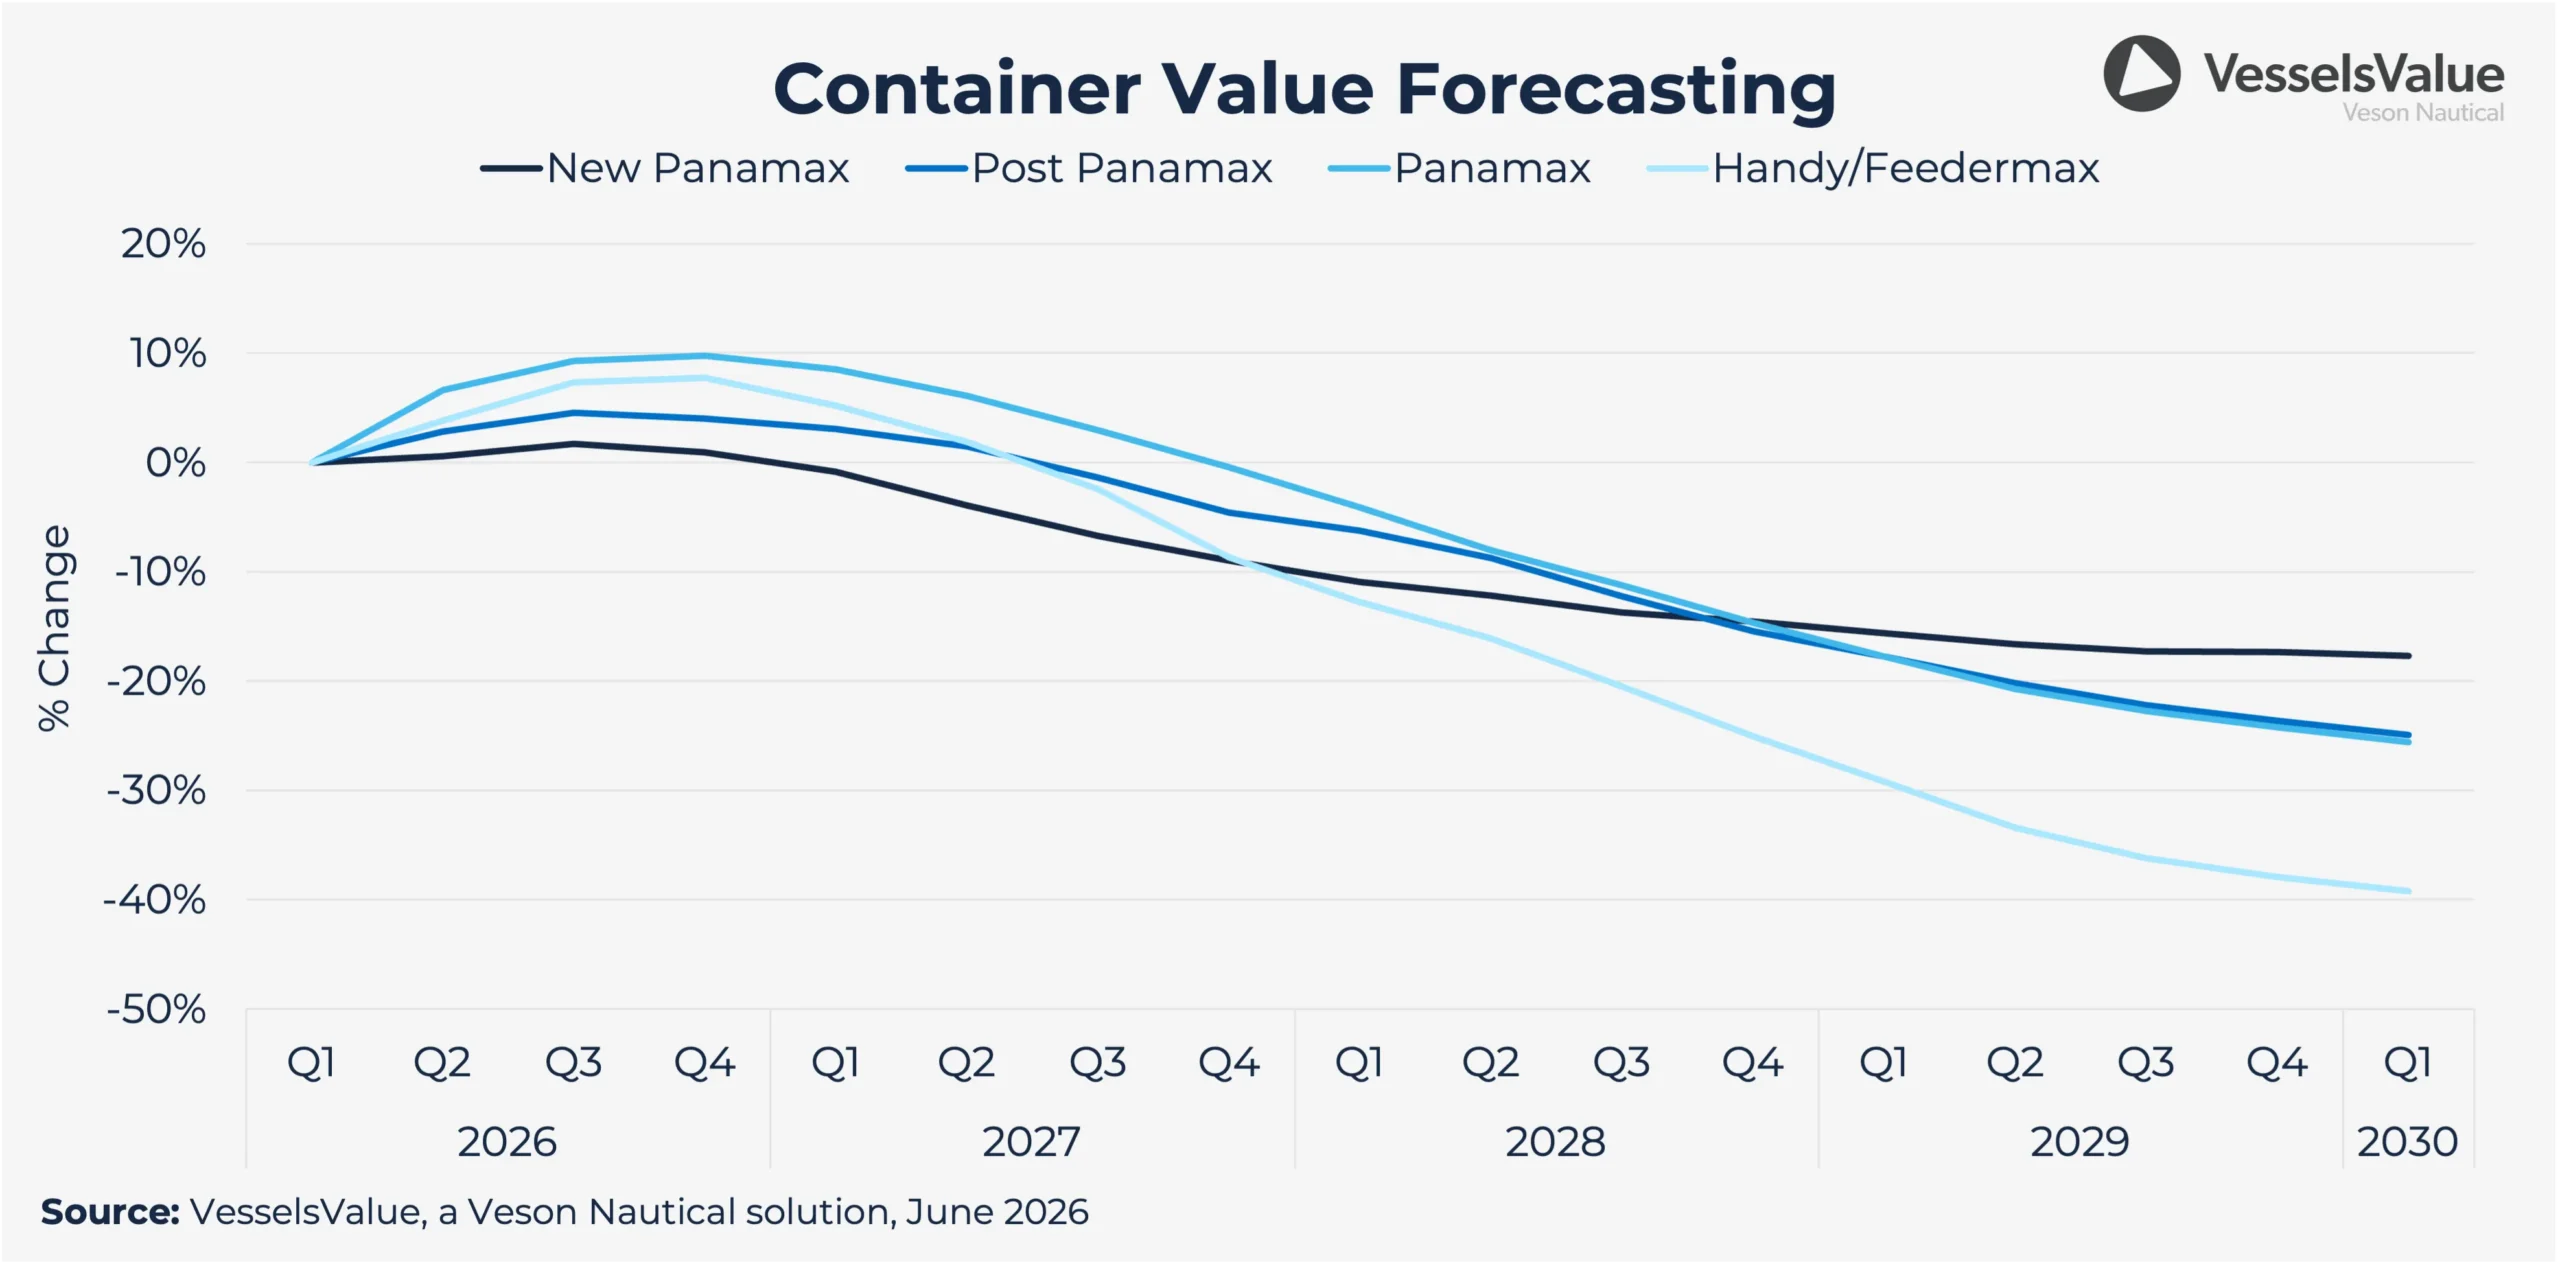
- Container earnings are broadly stable, up approximately 3.9% across vessel sizes in Q2; Cape of Good Hope diversions continue with no Red Sea return in sight, sustaining elevated TEU-mile demand; Asia–North America volumes down 2.9% in 2025 and a further 0.4% YTD under US tariff pressure.
- TEU-mile demand growth of 2.9% forecast for 2026, averaging 4.1% per year in 2027–2029 as Chinese export expansion continues; however, energy disruption could weigh on H2 2026 volumes.
- The orderbook exceeds 13 mil TEU with an orderbook-to-fleet ratio approaching 40%; net fleet growth averaged 9.7% and 8.6% in 2024 and 2025, projected at 10.2% over 2026–2029, materially outpacing TEU-mile demand.
- Freight rates are forecast to decline 29.6% on average over the forecast period; idle capacity is expected to rise but is insufficient to offset the supply/demand imbalance by period-end.
- Scrapping is expected to accelerate, particularly in the sub-3,000 TEU segment; Container ordering is projected to slow considerably from 2027 as oversupply pressure builds and yard competition intensifies.
LPG
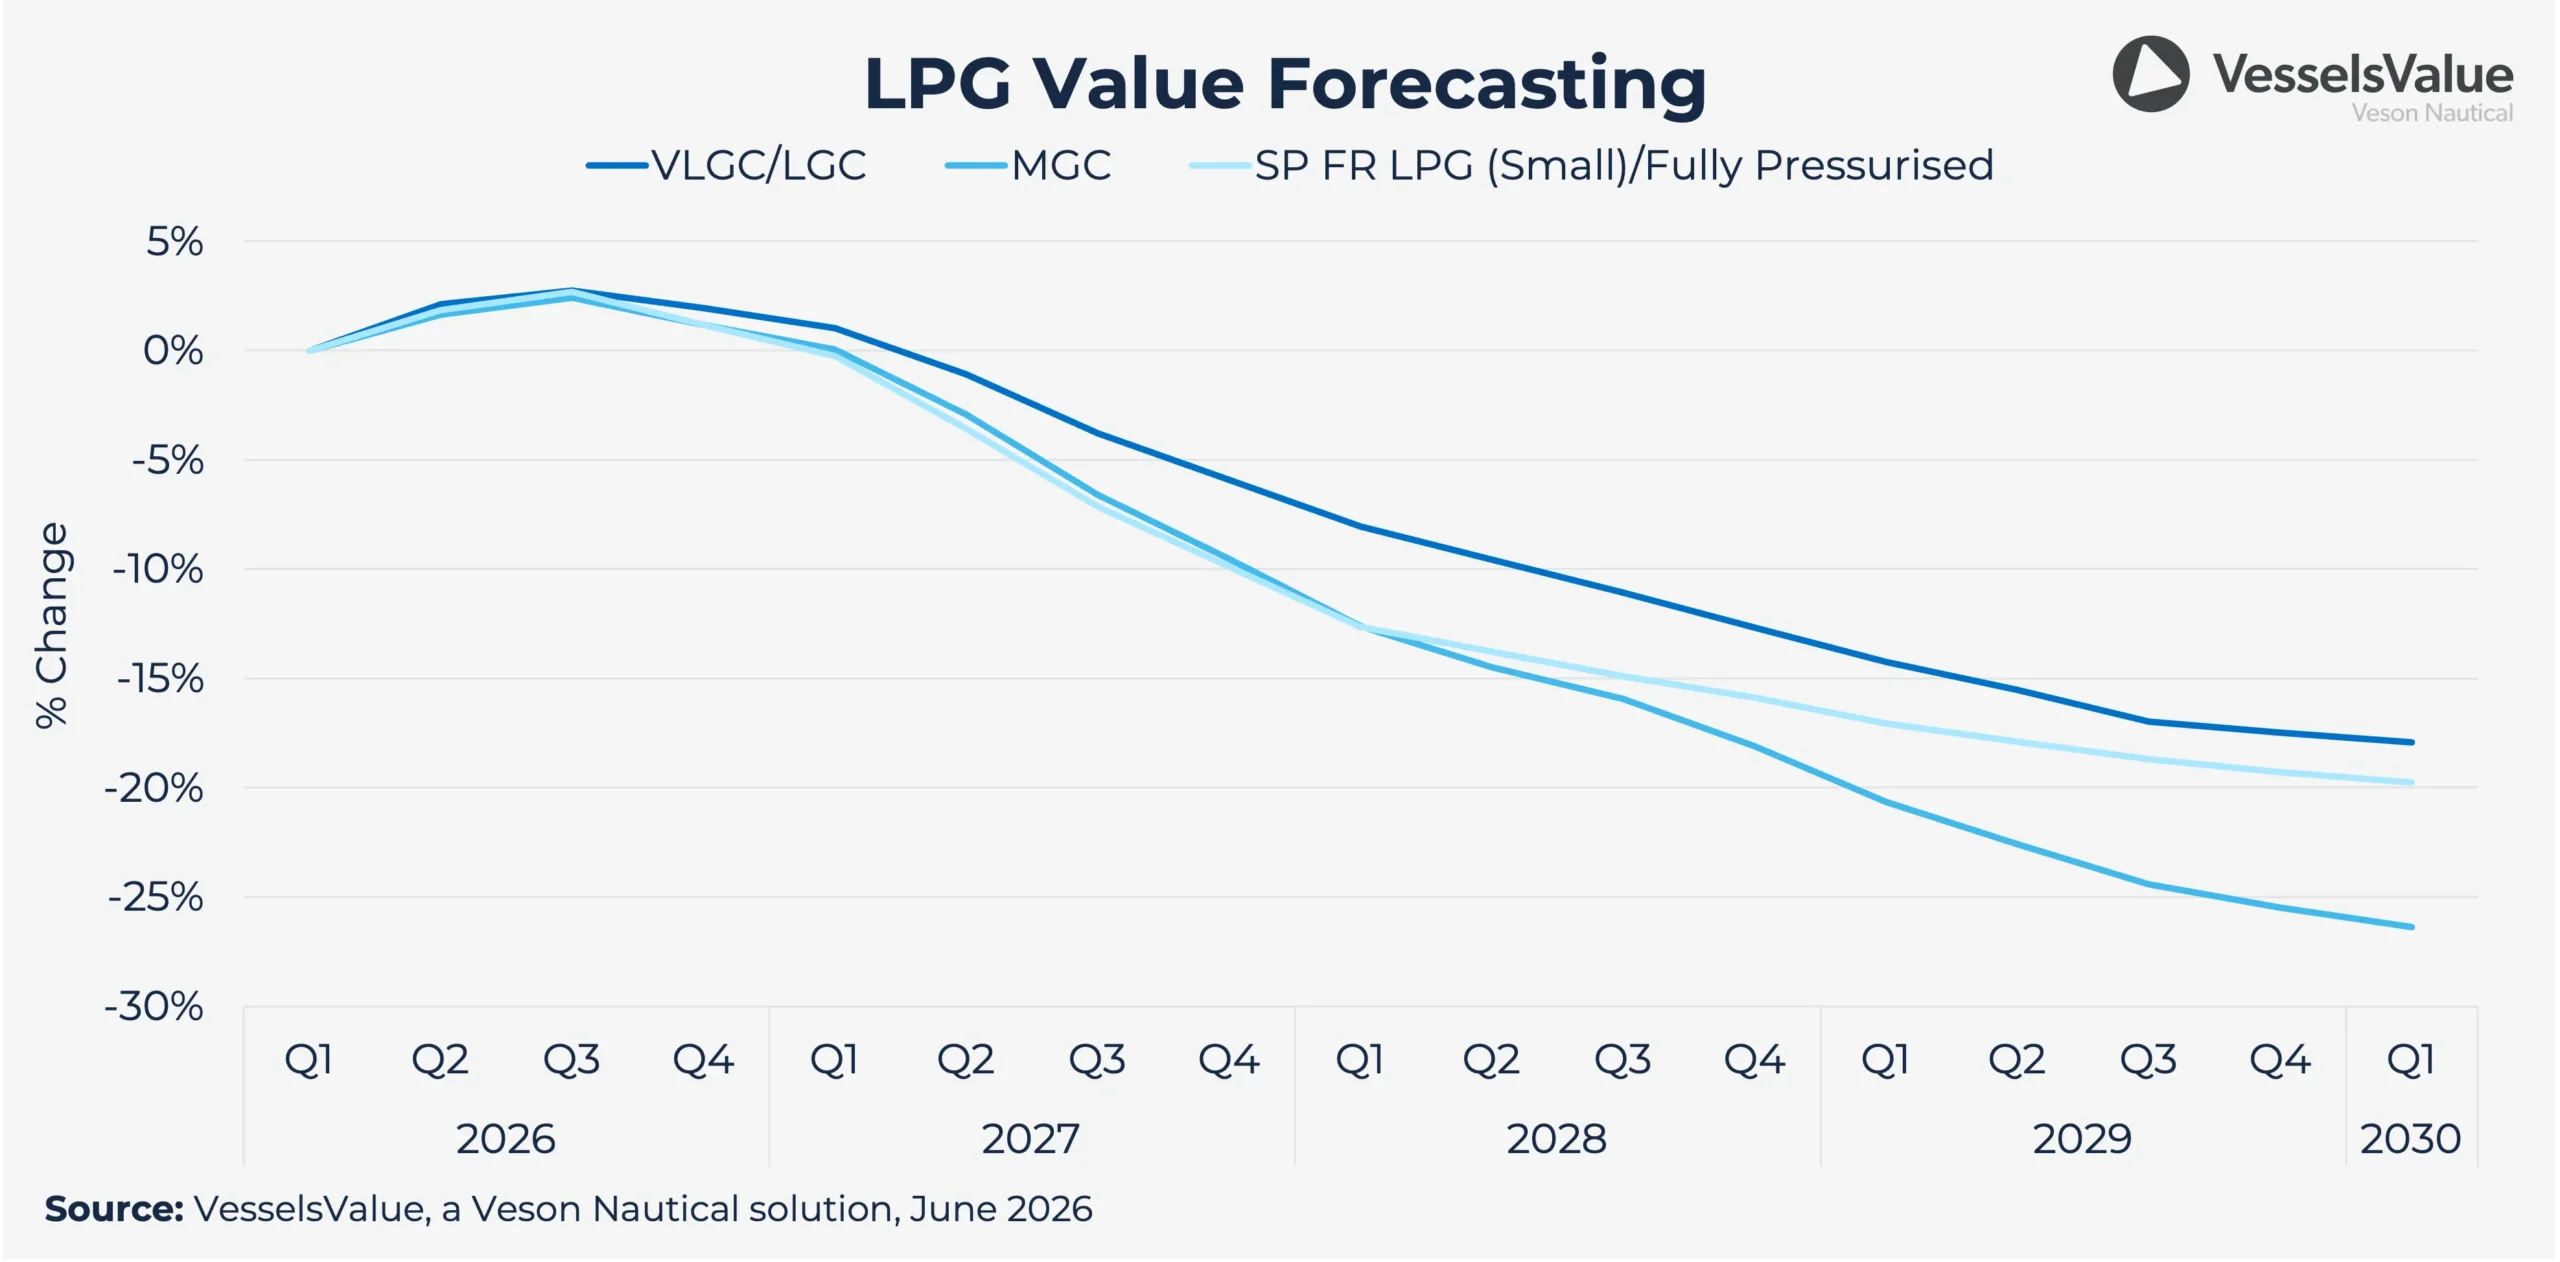
- VLGC spot rates averaged approximately 110,000 USD/day YTD, vs. approximately 48,000 USD/day in the same period last year, peaking at approximately 200,000 USD/day in May; the Hormuz closure removed approximately 3.5 Mt/month of Middle East LPG from global markets, with US propane exports rising 6.7% YTD to partially offset.
- US LPG exports forecast to grow 9.3% in 2026, backed by NGL-rich wells and higher energy prices; the Panama Canal is expected to be operating at full capacity with El Niño-related draft restrictions anticipated in the coming months.
- Middle East LPG export volumes are forecast to decline 48% in 2026, recovering from 2027 at approximately 31.2% average growth per year, though 2027 volumes still expected to remain below 2025 levels.
- The VLGC orderbook-to-fleet is at approximately 28%; 38 VLGCs/VLACs ordered in Q2 2026 alone vs. 10 for all of 2025; net fleet growth of approximately 8.9% per year over 2026–2029 puts market balance under significant pressure from 2027.
- Seaborne ammonia trade at risk: the Middle East accounts for approximately 25% of global exports, with project delays and supply disruption limiting near-term growth despite a growing blue and green ammonia pipeline globally.
Vehicle Carriers
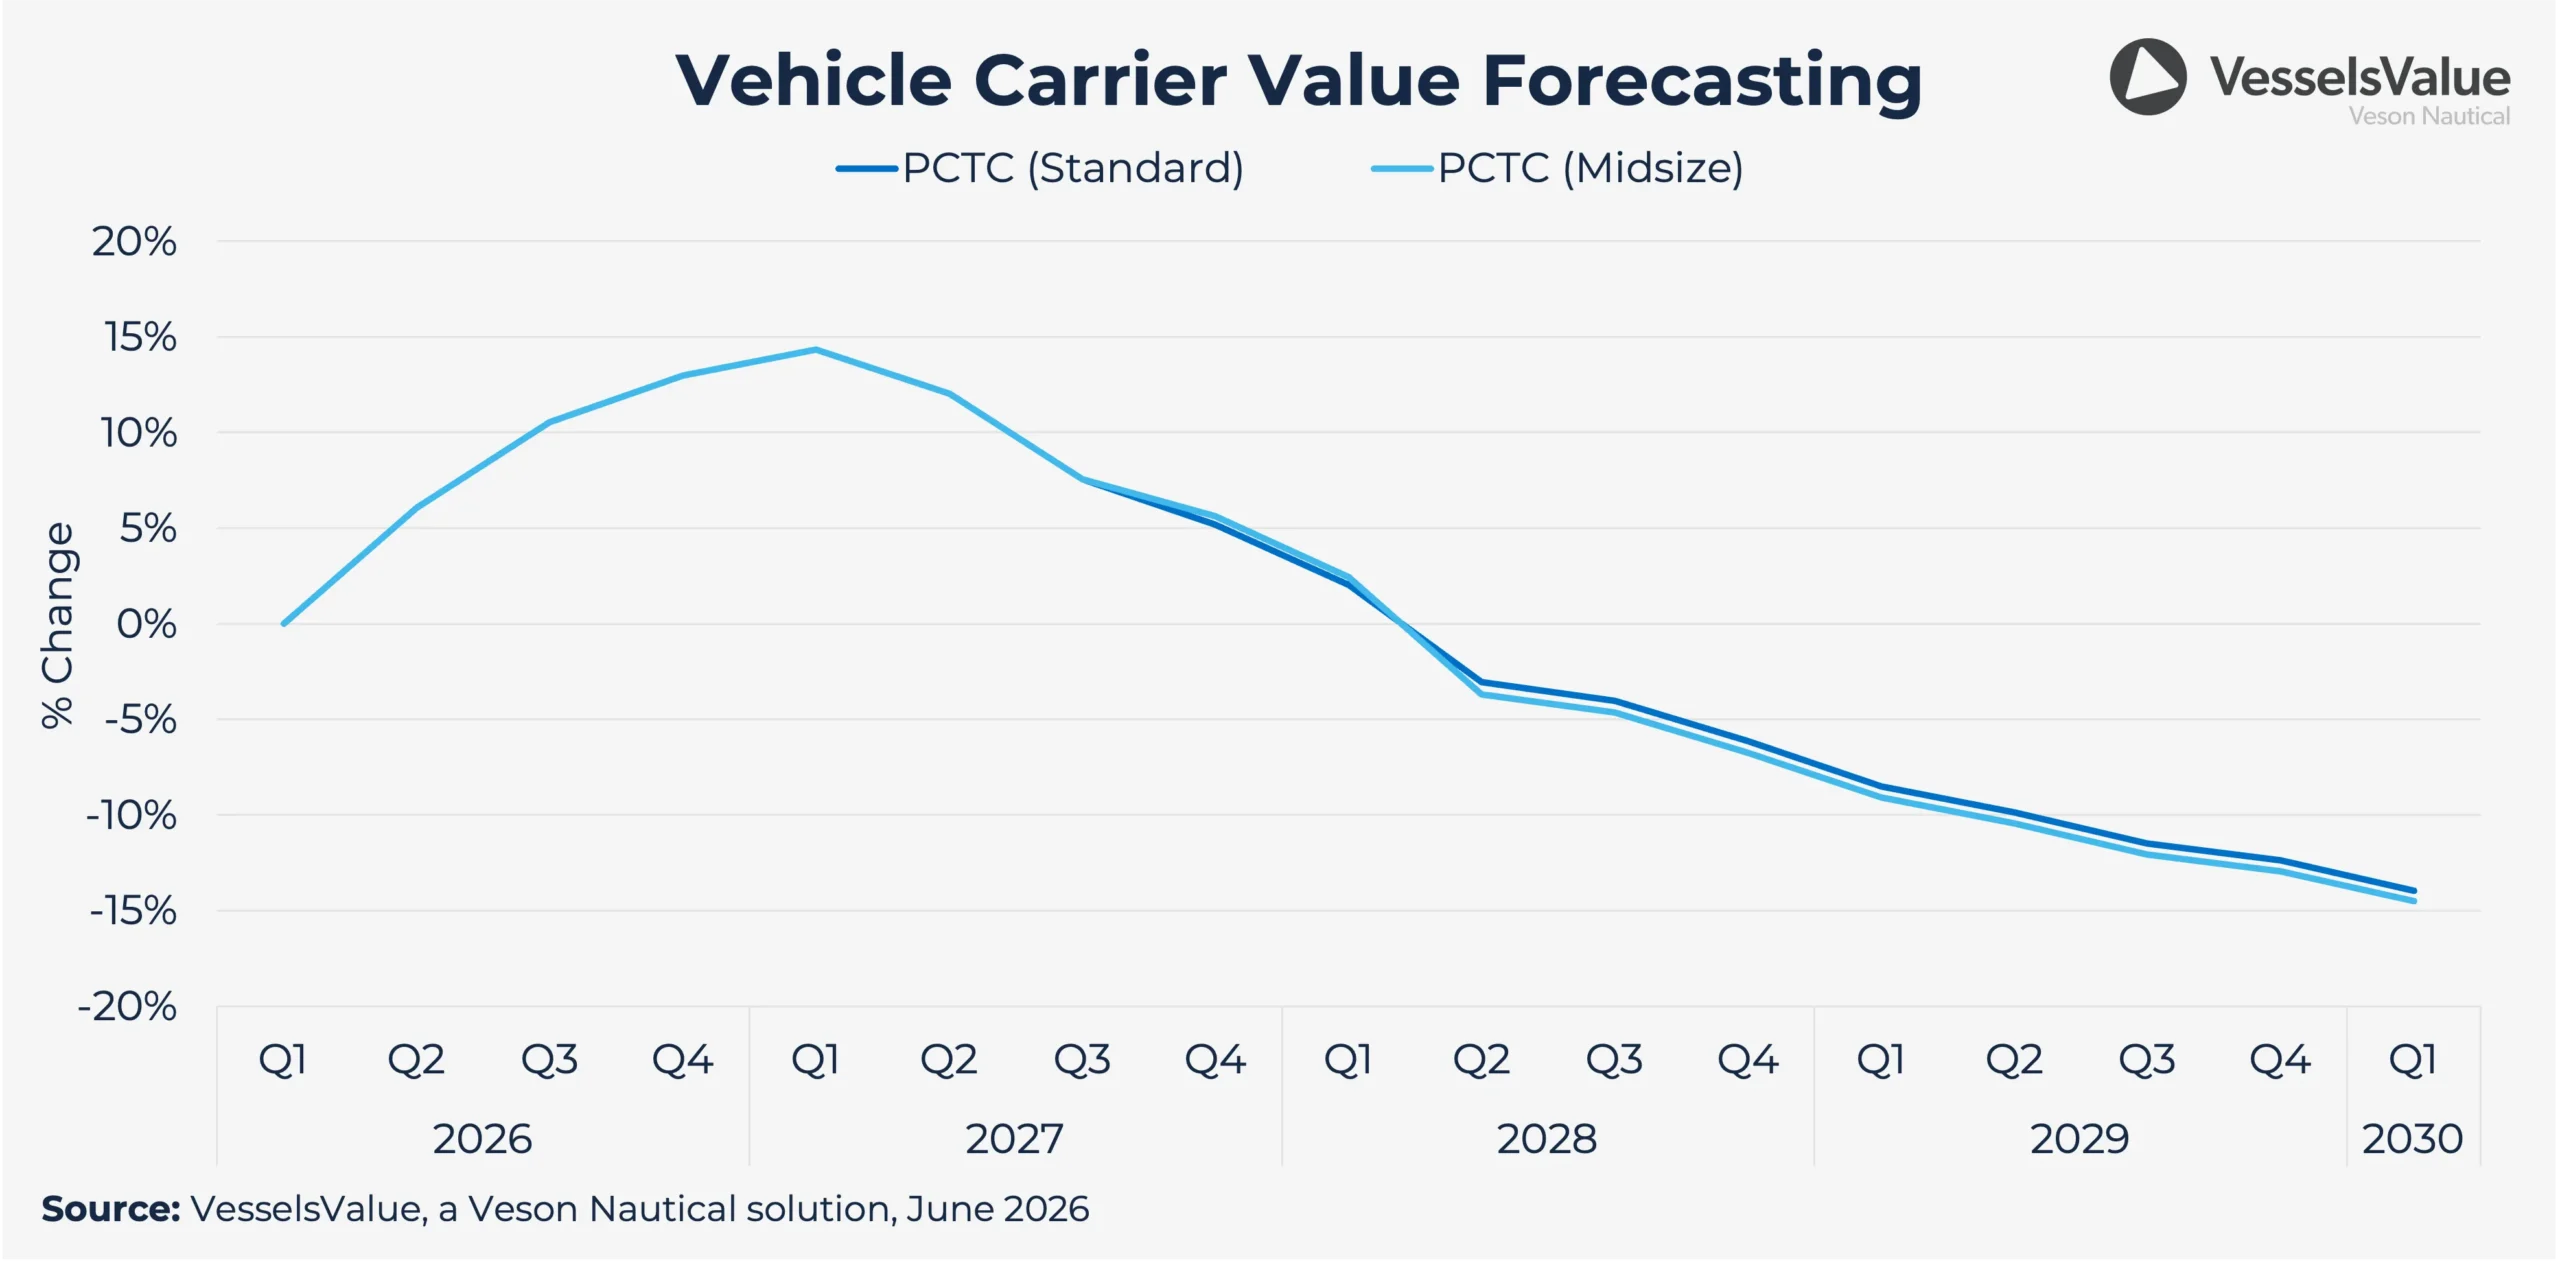
- One-year Time-Charter rates for standard PCTCs averaged 52,200 USD/day in Q2 (+14.1% quarter-over-quarter), with midsize PCTCs at 35,700 USD/day (+29.2% QoQ); Chinese light vehicle exports grew 63% year-on-year Jan-May 2026 despite Middle East tensions threatening approximately 15% of China’s export volumes.
- Newbuild ordering reignited sharply after a cautious 2025: 87,200 CEU of confirmed orders in Q2 2026 (+275% QoQ, +652% year-on-year), reversing the 2021-2024 cycle that averaged 77 vessels ordered per year.
- Secondhand values held firm, with five-year-old PCTC (Standard) and PCTC (Midsize) at USD 82 mil and USD 62 mil respectively (+2.9% QoQ); Cape of Good Hope diversions, stretching Asia-Europe voyages by approximately 25%, are keeping CEU-mile demand elevated, averaging 7.3% growth in 2026-2027.
- 2028 is expected to mark an inflection point if the fleet returns to shorter Suez transits: supply is projected to outpace CEU-mile demand growth by approximately 6%, pressuring rates and values; over 120 vessels aged 25 years or older are prime candidates for accelerated scrapping.
- Rates are forecast to rise approximately 1.6% on average across all sizes in 2026, with PCTC Standard reaching 69,800 USD/day (+19.2% year-on-year) and PCTC Midsize at 48,800 USD/day (+22.5% year-on-year) in 2027; values are expected to correct from 2028.
Check out the 2026 Mid-Year Shipping Market Report, a free 60+ page analysis covering 10 market sectors, for a look back at the key trends year-to-date.
All information provided is for informational purposes only. To the extent that any provided information is based on Veson Data, Veson excludes to the extent permitted by law all implied warranties relating to fitness for a particular purpose, including any implied warranty that Veson Data is accurate, complete, or error free. Veson Data are collated and processed by and on behalf of Veson in accordance with methodologies and assumptions published and updated by Veson from time to time which do not take into account particular circumstances applicable to individuals and therefore; (i) are made available on an ‘as is’ basis; (ii) are not intended as a substitute for formal valuations; (iii) should not be used solely as trading, investment, or other advice; and (iv) are not intended as a substitute for professional judgement. To the extent permitted by applicable law, Veson shall have no liability to party for any errors or omissions in the content of the information provided.
WEBINAR