
Maritime Operations professionals often experience information overload when managing voyages. Thousands of data points are generated every minute, and communicated through various means such as email, phone, and technical reporting software.
Key voyage information is communicated asynchronously by various counterparties and requires formatting to be actionable and fit in with the rest of the voyage dataset contained within a system, like the Veson IMOS Platform. For example, when operating global voyages, ETAs are displayed in different date and time formats, and ports are called slightly different names in different languages, which leaves room for misunderstandings and costly errors.
There is a lot that can be done in the IMOS Platform to standardize maritime processes. Vishal Khattri, Director of Professional Services at Veson Nautical, gives a really good overview of how to scale operations by harmonizing data in this blog post on data standardization and integration. However, sometimes even standardizing communication through well thought-out digital processes is not enough.
In addition to standardized data, we provide another powerful tool for operators: the IMOS Fleet Map, a centralized workspace where users can manage all work related to current fleet operations.
This functionality collects data from all sources connected to IMOS, including AIS data from Oceanbolt, and displays the latest known vessel positions, including important contextual information such as cargos aboard and voyage status. Through new, enhanced filtering you can instantly get a bird’s eye view of your fleet, monitor individual vessels and cargos, and make quick, data-backed decisions in the case of an operational emergency.
The Fleet Map remains part of the core IMOS offering and can be found in the Operations module at no additional cost.
In this blog, I’ll explain how you can benefit from the IMOS Platform’s Fleet Map, and why we decided to invest in this enhancement of our core system.
Displaying Data Dynamically and Visually as the Voyage Progresses
Most voyages progress linearly according to a set itinerary – from point A to B to C. Most operational complexity, as well as most unforeseen costs, fall into one of the following three categories:
- unpredictability of conditions at sea
- port congestion, which has peaked at most large commercial ports during the COVID pandemic, and is still ongoing due to worker shortages- the repercussions are expected to last years
- vessel or equipment failures, such as an engine malfunction at sea, or a broken crane at a berth
All of these issues cause delays, and a domino effect on future voyage legs, causing both extended voyage costs, and opportunity costs related to future voyages.
Can we prevent these issues by visualizing what’s about to happen to our vessels?
In the era of digitalization, it’s important to account for how our brains best absorb new information. How can we maximize our retention of important data required for making timely decisions? How can we help ensure that our operators can act as quickly as possible in case of a crisis? Visualization is a great tool to apply here as approximately 65% of the global population are visual learners, meaning they need to see information in order to retain it.
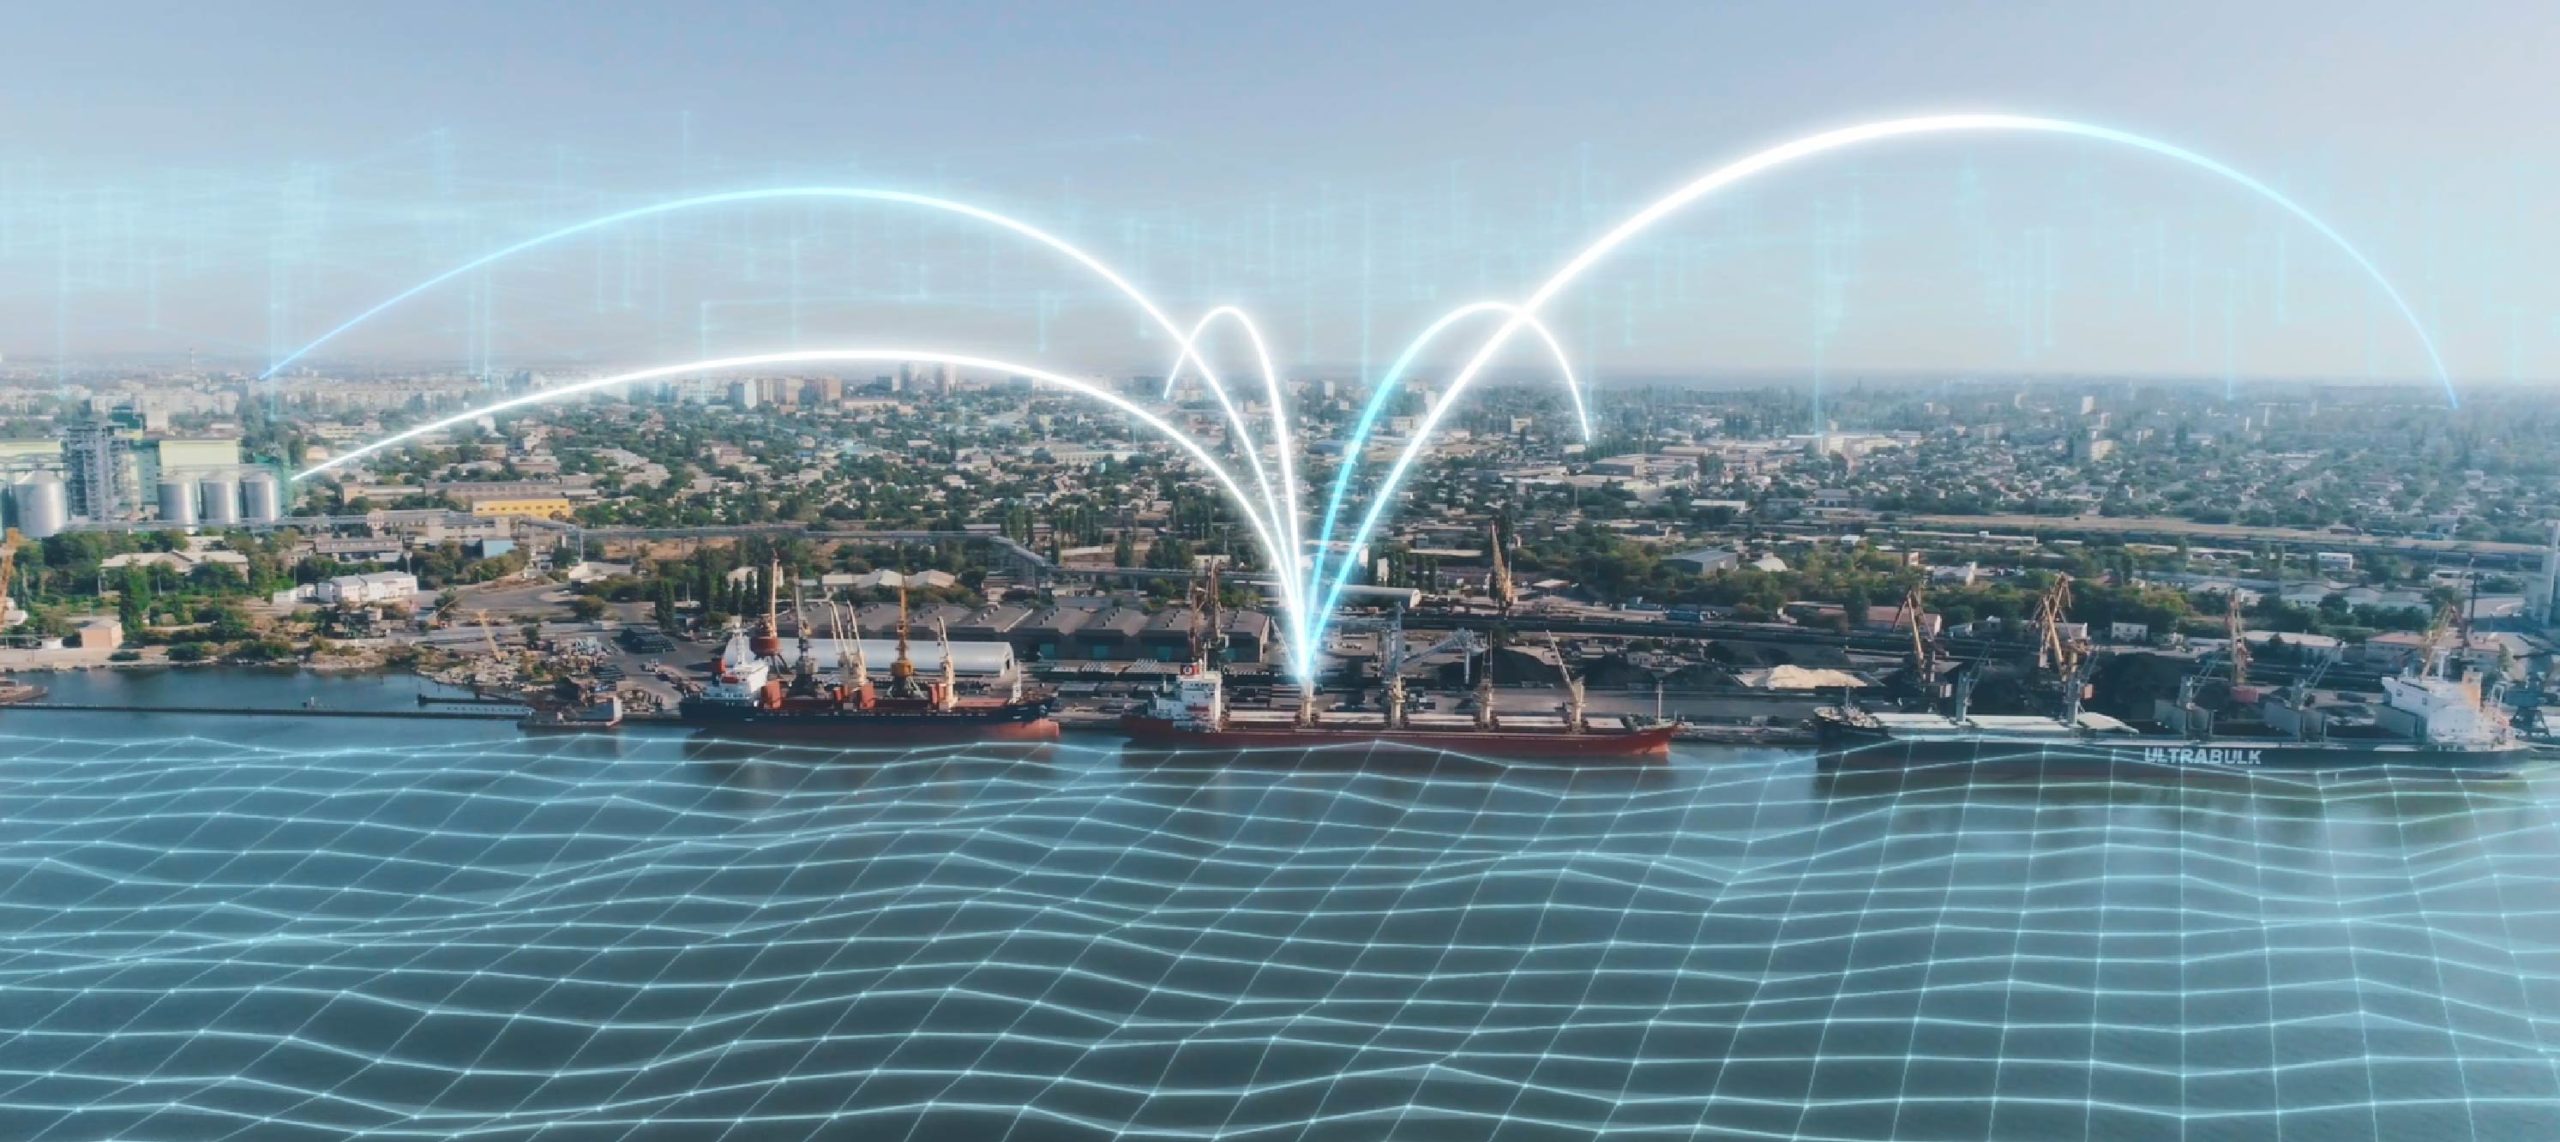
Processing voyage data on a map, rather than by reading it as figures and words, can drastically reduce the time required by operators to understand the state of a voyage. It’s easy and intuitive to understand the future of a voyage by viewing the projected itinerary of a vessel in map format. Through visual indicators, operators can see whether a vessel is about to encounter an issue, such as heading into a hurricane or piracy zone.
This frees up mental capacity, which can be used to optimize decision making: a classic use-case of how digitizing a workflow and processing data effectively can enhance business output.
Converging Disparate Data to Maximize Profitability
We at Veson can’t necessarily control how data comes into our system, be it various APIs, emails, or carrier pigeon. However, we can control how it is displayed, based on how our operators process data.
The IMOS Fleet Map systematically combines all existing sources of data by displaying the latest information available, giving voyage managers the confidence to make important decisions swiftly.
Upon opening the workspace, all commenced voyages are displayed by default, with the option to add scheduled voyages, and voyages completed up to 60 days in the past. In case of highly trafficked areas, vessels will be displayed as clusters, which users can click to neatly visualize individual vessels:
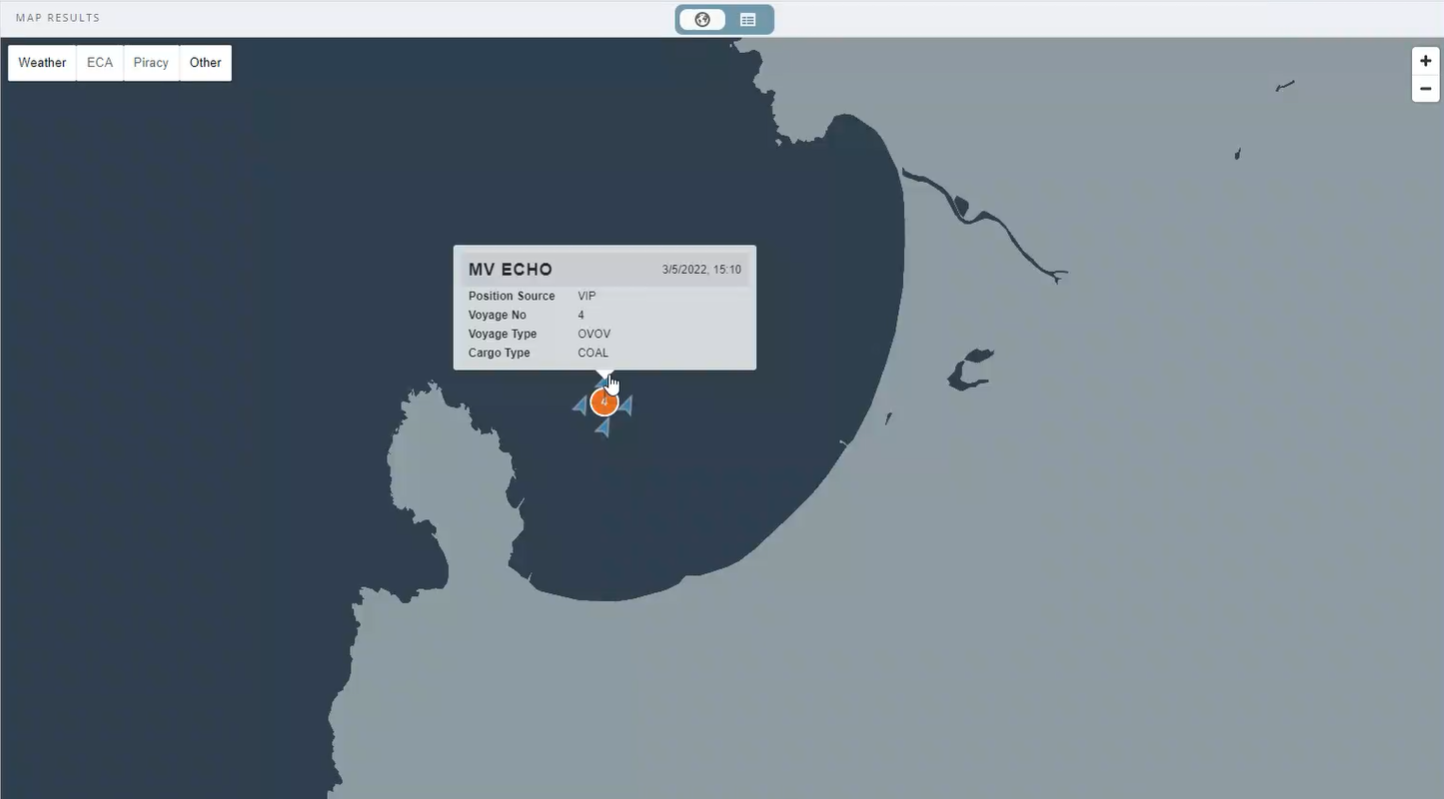
Enhanced filtering allows vessels to be filtered by counterparty, operation type, cargo, voyage status, port, and more. Leveraging filters ensures that only immediately relevant information is displayed, allowing users to focus on what matters the most.
Once users find what they need to focus on, they have the option to hover over vessels and ports to view additional contextual data, see the filtered voyages in list view, and open any voyage in the IMOS Platform to drill down deeper and take action.
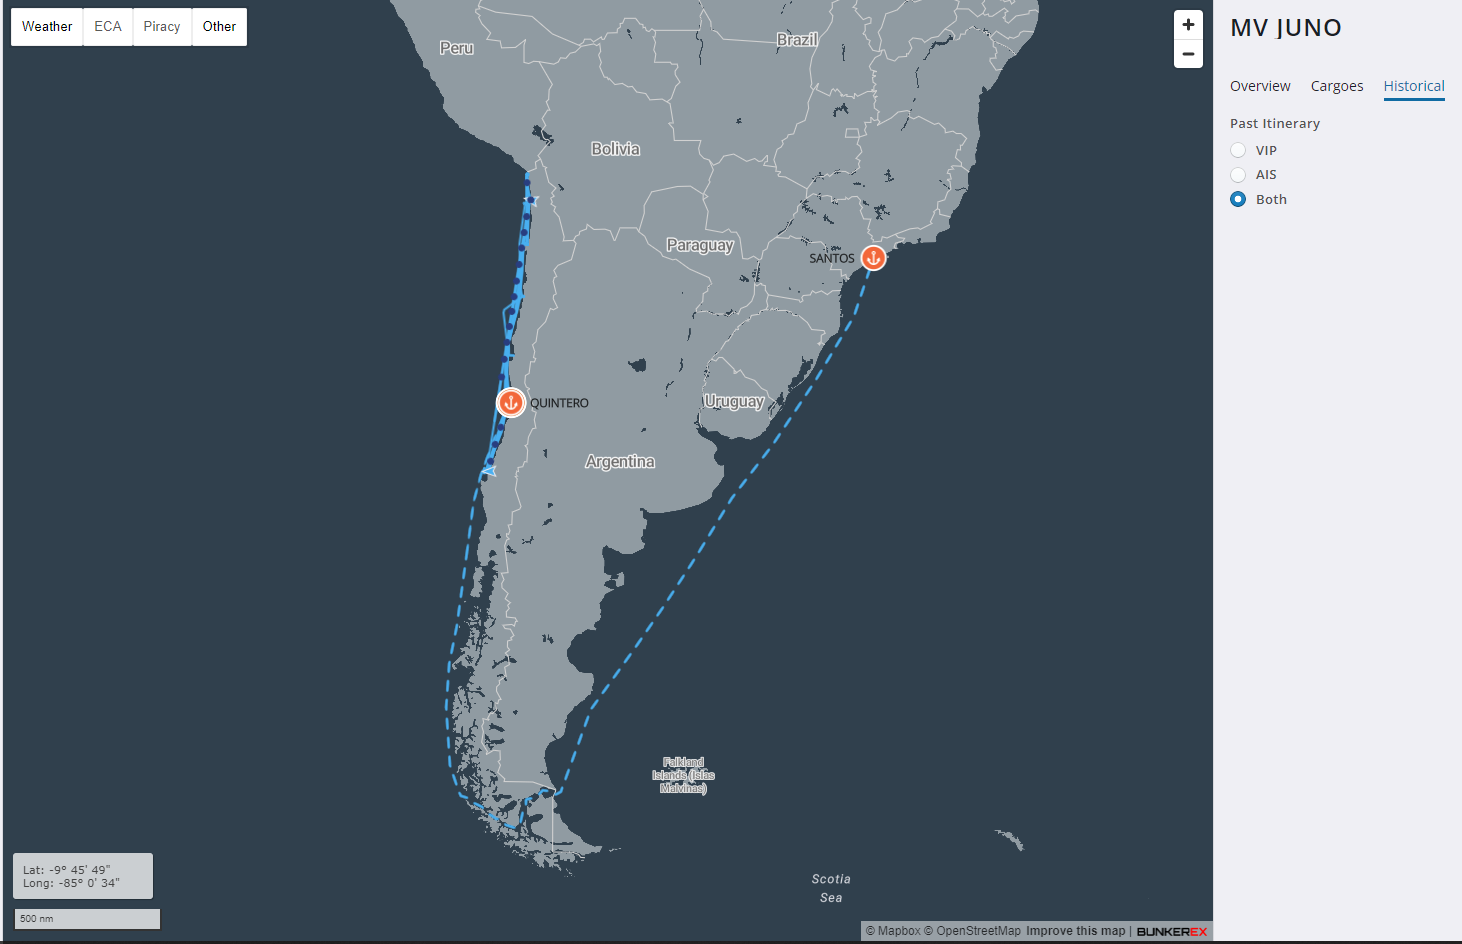
Operators can also click on a vessel to view their future projected route based on the IMOS itinerary, and select past routes based on AIS, IMOS itinerary, or both to compare. This gives an immediate visual in case there is any voyage which needs attention:
Recap
In Summary, the reasons to leverage the new Fleet Map for your operational workflows are:
- Preventing information overload by allowing operators to process incoming data visually, and be in the best position to make quick and accurate decisions
- Prevent issues and delays by visualizing how voyages progress in function of weather, port congestion, and other obstacles
- Maximize voyage profitability by converging data from multiple sources such as AIS, bunker prices, and port congestion
Paolo Vaccaro, Head of Operations at d’Amico Shipping Singapore Pte. Ltd., said this about the IMOS Fleet Map: “Maintain an on-the-ball focus – this should be the mantra for any users of complex applications. This means centralizing your efforts to avoid hopping between different windows and applications as much as possible. The new Fleet Map is a promising integration that allows us to access handy, up to date information plotted nicely into the same working environment as the rest of our operating and fixing processes. Bunker indications are very welcome! In summary, we appreciate the Fleet Map enhancements and we’re looking forward to next fine tuning.”
To see the IMOS Fleet Map product offering in action, log in to the Veson IMOS Platform.

 Jesse Dilanni
 Russ Hubbard
 Josh Luby