
At Oceanbolt we believe in making data available to our customers in the easiest and most seamless way possible. Therefore, we are continuously striving towards reducing and removing barriers for accessing, extracting and using our data. Up until now, the only ways to access the Oceanbolt Data Platform has been through our web-based dashboard solution (Oceanbolt Analytics Dashboard) and through direct interaction with our REST API.
This means that repeated extraction of data either had to be done through a manual process with csv/excel extraction from the Dashboard, or it required getting warm and cozy with our REST API which includes writing a lot of boilerplate code to parse requests and responses.
Therefore, we are super excited to announce that we are now launching two new powerful tools that can be used to interact with our data and our platform. Namely:
- The Oceanbolt Excel Add-In
- The Oceanbolt Python SDK
NB: These tools are only available to our customers have a API access included in the subscription.
The Oceanbolt Excel Add-In
The Oceanbolt Excel Add-In provides direct access to data available in the Oceanbolt Data Platform in a familiar and easy way. The add-in is available as separate menu in the top panel of Excel. Through this menu users are able to create and edit queries as well as refreshing existing queries. This means that users can design and build complex analytics models powered by Oceanbolt data in Excel, and have the data refreshed instantly in a seamless way.
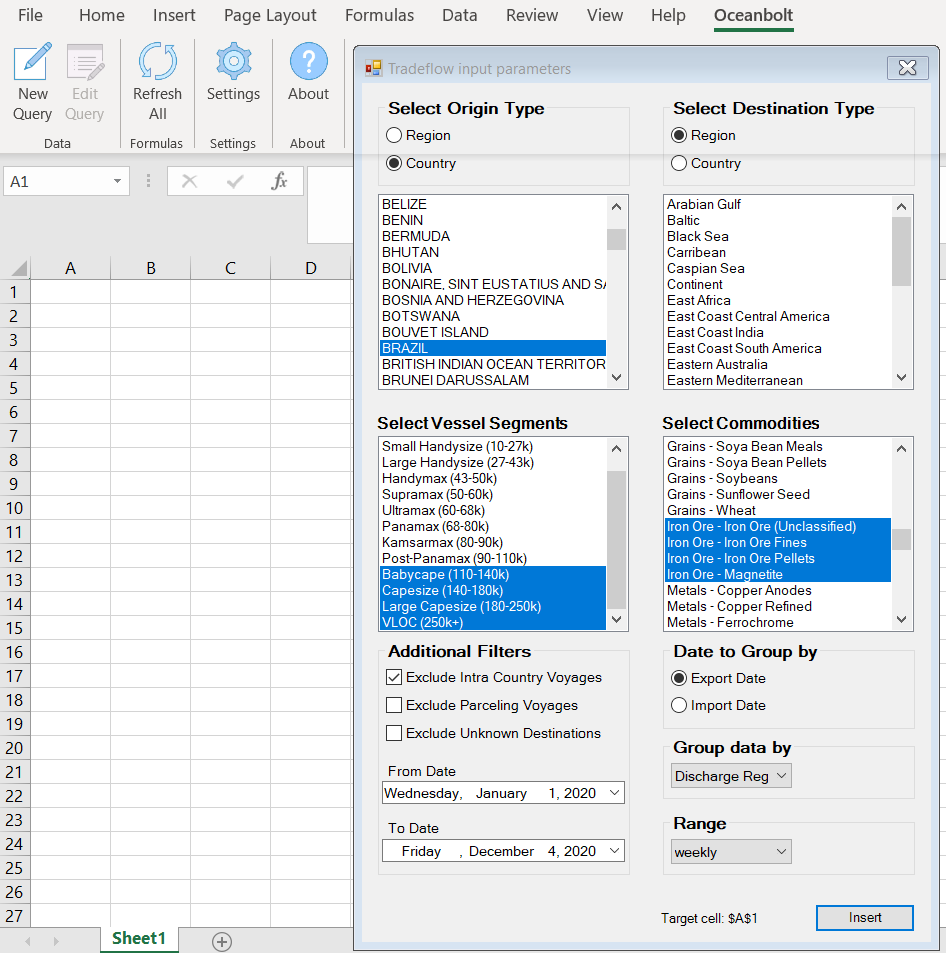
The Excel Add-In can for example be used to display most recent port calls for any vessels, or to extract global/regional aggregated timeseries data for import/export of any commodity. Users are able to customize and filter the queries on exactly the same parameters as in the Oceanbolt Analytics Dashboard.
The Excel Add-In can be downloaded from the link available in the platform documentation.
The Oceanbolt Python SDK
The Oceanbolt Python SDK provides data scientists or market analysts a powerful way of interacting directly with Oceanbolt’s vast array of data types and timeseries. The Python SDK empowers and users to quickly build and deploy custom reports or advanced freight/commodity models. The SDK has interfaces to query and extract Oceanbolt data in a simple way that will make data scientists rejoice. Data is returned directly in the form of pandas.Dataframe(), making it easy to do further analysis and data processing using the excellent Python data science ecosystem.
The full documentation is available at:
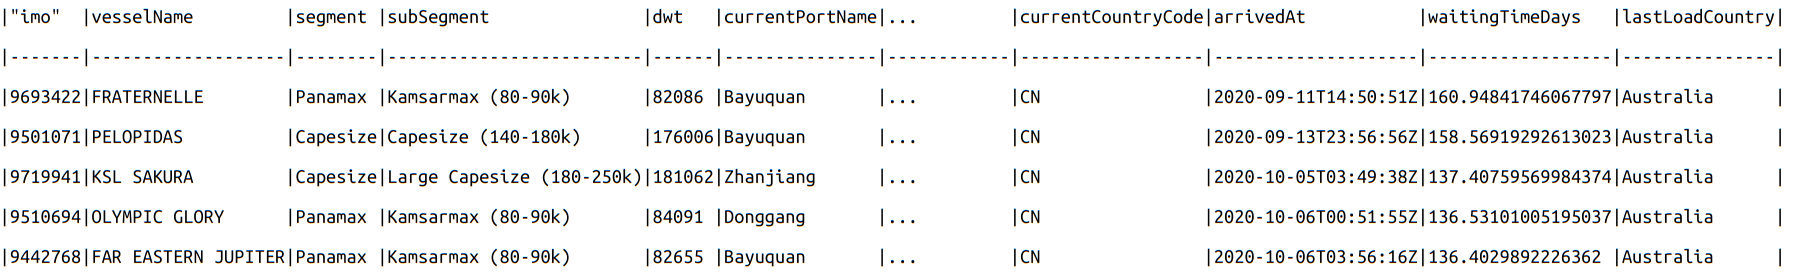
For example to get a live list of vessels currently congested in China carrying Australian coal, we would just issue the following query:
Example:
from oceanbolt.sdk.client import APIClient
    from oceanbolt.sdk.data.congestion import CongestionVessels


    base_client = APIClient()
    df = CongestionVessels(base_client).get(
        country_code=['CN'],
        last_load_country_code=['AU'],
        commodity_group = ['coal'],
    )
Which results in the following Dataframe.
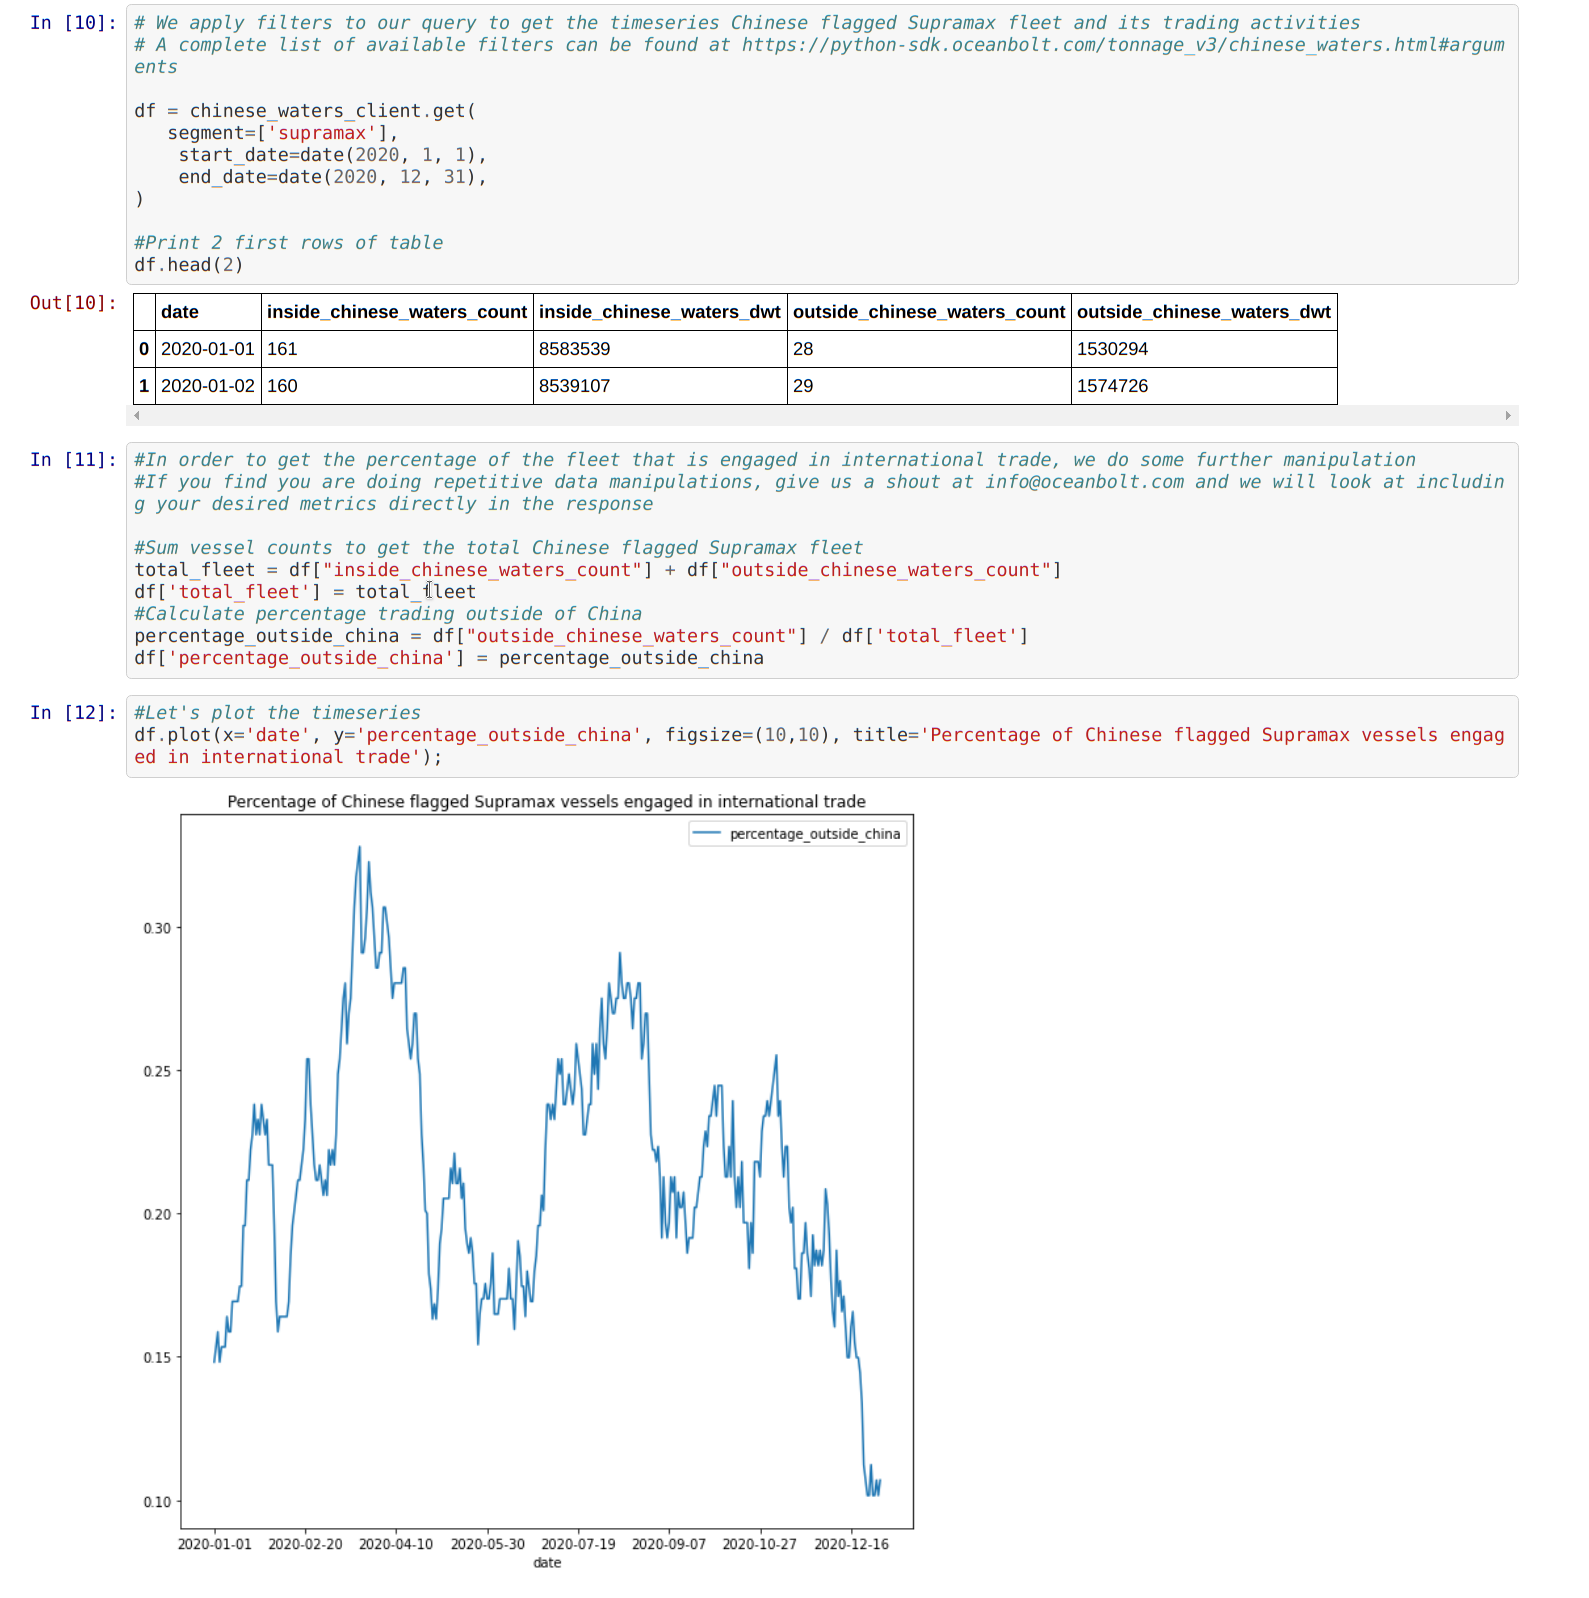
The Python SDK can be imported directly into existing tools, applications or Jupyter notebooks. An example of integration into a notebook is shown here, where we investigate the percentage of Chinese flagged vessels that currently trade inside vs outside of China.
With the launch of these tools, we have taken a major step towards making data available to freight/commodity analysts, exactly in the easiest and most seamless way possible.

 Mikkel Nordberg
 Veson Nautical
 Philippe Pagnotta