
Congestion is a recurring topic in the dry bulk shipping industry that we have been highly focused on as dry bulk data specialists at Oceanbolt. In 2020, we saw the China / Australia trade dispute causing a build up of vessels laden with Australian coal congested in China. In 2021 we witnessed and documented the build of congestion in the Suez canal during the Evergiven blockage. Now in 2022, only a few days into the year, we already have the next congestion topic building up for coal-carrying vessels in Indonesia. As reported by TradeWinds, the congestion appears to be happening on the back of an Indonesian coal export ban that was instated by the Ministry of Energy & Mineral Resources on the basis that domestic resources for coal-fired power plants are critically low. We decided to explore how this is currently impacting congestion in Indonesia.
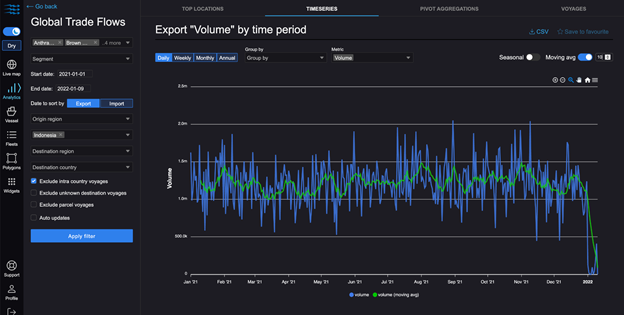
By using Oceanbolt’s web app, we will try to get an understanding of what the impact of the export ban is for the dry bulk industry. In order to contextualize the importance of the Indonesian coal export for dry bulk shipping, we use Oceanbolt’s Global Trade Flow Module to plot the daily volume of coal exported in Indonesia from 01 Jan 2021 to 09 Jan 2022 (see Figure 1). As anticipated the daily volume steeply drops at the onset of 2022, specifically the 10 day moving average of Indonesian coal exports was in the range of 1.0 million to 1.4 million metric tons for all of 2021, while as of 09 Jan 2022 it has dropped to 0.1 million metric tons.
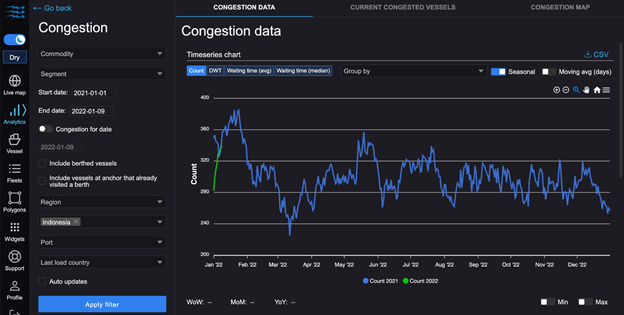
We are hardly surprised that an export ban causes a drop in the daily volume of exports, but what is more interesting is to understand how this export ban impacts congestion. Therefore, we turn to Oceanbolt’s Congestion Module to first get an insight into the development of total congestion in Indonesia. Figure 2 plots a time series of the total number of dry bulk vessels congested across all of Indonesia. Interestingly, the total number of dry bulk vessels congested in Indonesia is fewer than for beginning of January 2021, however, we are seeing a steeply increasing trend.
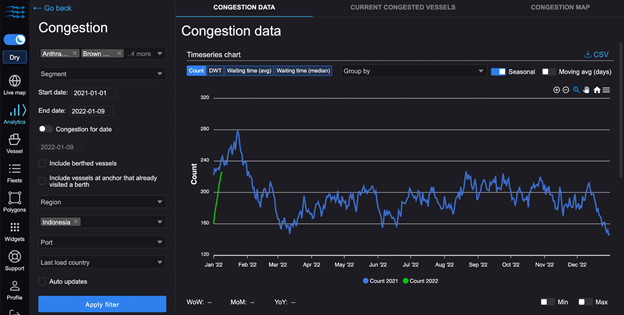
Oceanbolt’s Congestion Module allows us to drill further down on congestion for individual commodities and knowing that the export ban is in effect for coal, let us use this to narrow down our analysis. Figure 3 paints a similar picture that the number of dry bulk vessels laden with coal in Indonesia, currently 226, is not higher than it was in 2021, where on January 9th there were 246 vessels laden with coal congested in Indonesia. We can therefore conclude that the export ban has not yet caused an abnormal number of congested dry bulk vessels.
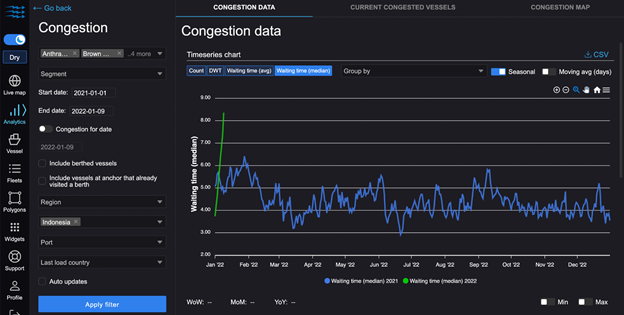
The number of congested vessels, however, is only one of the metrics for congestion that the Oceanbolt Congestion Module allows its users to track. Another important metric is the median waiting time among the congested vessels. Figure 4 plots this number since 01 Jan 2021 and here we notice the real impact of the export ban, namely, that the median waiting time for congested vessels carrying coal in Indonesia is currently 8.4 days versus 6.4 days at its peak in all of 2021. The impact should come as no surprise to those who have been following the situation, as it was reported that partially laden and fully laden vessels were denied permission to leave Indonesia. As the Indonesia port infrastructure is not equipped with proper equipment to offload vessels, an increase in the average time at the loading anchorages was therefore to be expected.
If you want to follow the development of congestion in Indonesia and unlock more detailed analysis, such as getting a list of every congested vessel, get in touch and sign up for a free trial of Oceanbolt by following this link: https://veson.com/oceanbolt-free-trial/.