
It is no secret in the maritime industry that there is a lot of uncertainty around vessel arrivals. Unexpected events such as adverse weather conditions and COVID-19 lockdowns can disrupt the normal operations of a port, but even without these, understanding the actual lineup of vessel arrivals across every port globally is typically difficult for market participants. Arriving at ports only to wait in line leads to excess demurrage costs and fuel consumption, driving up costs.
Through working closely with our clients at Oceanbolt, we have heard about these issues first-hand and decided to tackle the problem of predicting where every commercial vessel is headed and when it is likely to arrive. This August we released our first solution to this problem, the Oceanbolt Traffic Prediction module.
Methodology
The Traffic Prediction module is based on two machine learning algorithms that predict the destination as well as arrival time at that destination for every vessel. To predict destination ports, we generate a set of potential candidate ports looking at where similar nearby vessels have historically gone and what the current reported destination is. We then score these candidates using a set of deep learning models for each type of candidate, which looks at features including the percentage and distance-weighted count of historical, similar, and nearby vessels that went to the location, how recently the reported destination was updated, and various static attributes of the vessel. Several of the top scoring candidates are stored in the platform.
To predict arrival times, we train a deep learning model to learn the expected speed to each predicted destination. This model looks at features including the vessel segment, the reported ETA, the distance to the target port, and the current speed, to name a few. From this predicted speed combined with our distance calculator’s distance, we can compute the expected arrival time.
You can learn more about our methodology by visiting the module in our Web App.
Use Cases
Now that we have explained how the model works, let us dive into how users might use the forward-looking predictions of vessel arrivals.
The chart below shows predicted Capesize arrivals for the three largest Brazilian iron ore exporting ports: Ponta Da Madeira, Tubarao (Praia Mole), and Itaguai over a rolling 4-week window. At the time the chart was created, the model had predicted 76 Capesizes would arrive to these ports over the following 4 weeks, while 100 arrivals actually occurred. What is important, however, is the trend of the prediction chart versus the actual chart, as our focus is identifying port activity trends. Hence, what is most interesting is the range of future-looking dates. For the next four weeks (until September 21st), the model is predicting that activity will pick up at Ponta Da Madeira, Tubarao (Praia Mole), and Itaguai with 119 predicted Capesize arrivals. This information might be interesting for anyone following the Brazilian iron ore markets.
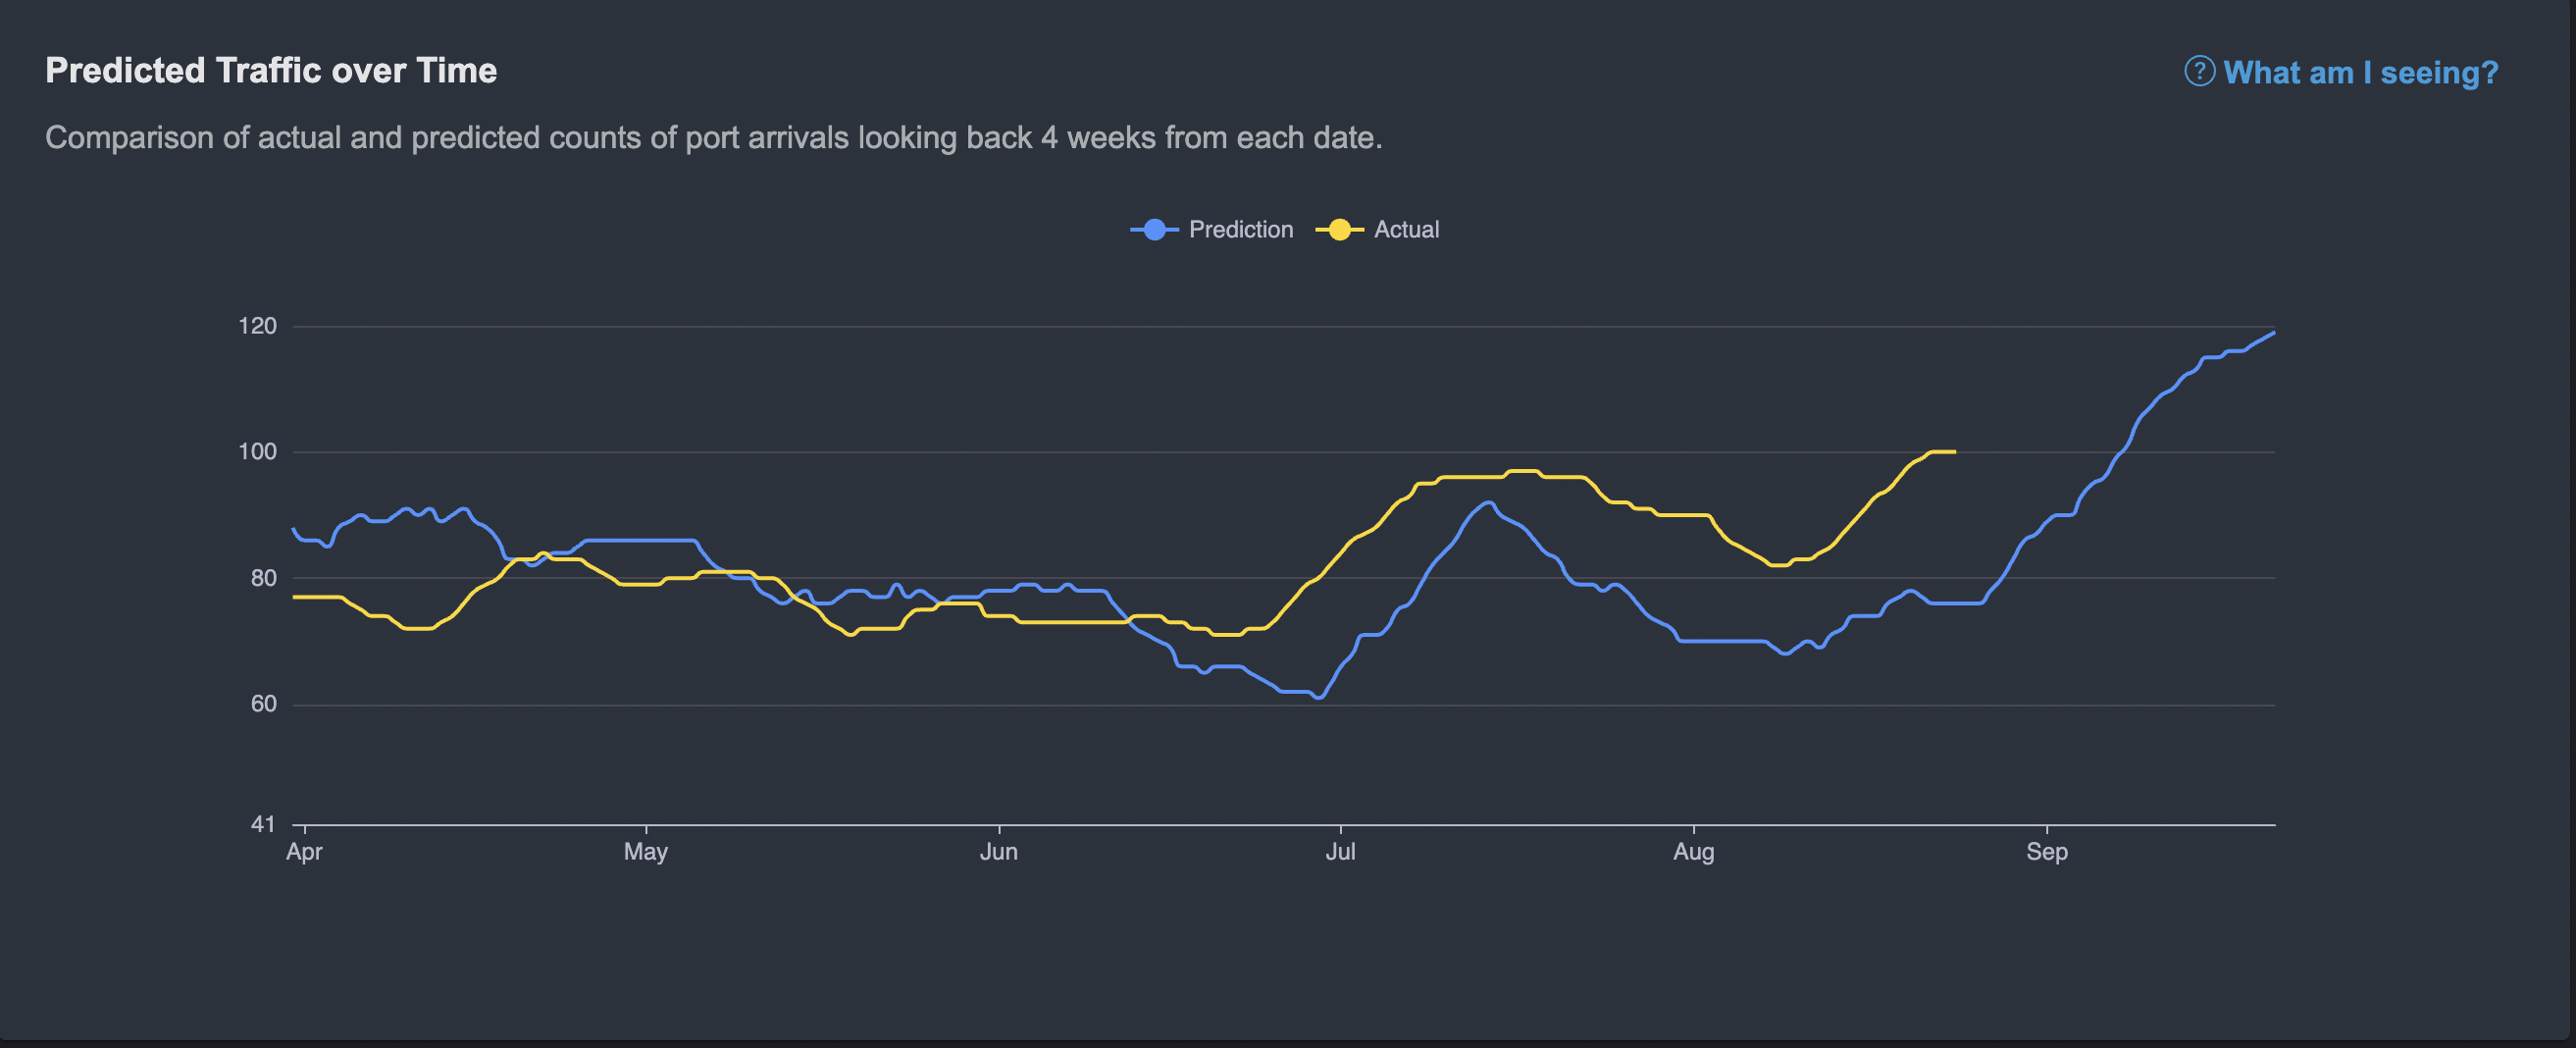
Figure 1 – Rolling 4-week Capesize arrival predictions for Ponta Da Madeira, Tubarao (Praia Mole), and Itaguai. The yellow line represents actual arrivals versus the blue predictions.
Another example would be to look at Handysize, Supramax and Panamax at Mesaieed, one of the world’s central fertilizer exporting ports. Here the model is predicting a somewhat lower number of arrivals over the next four weeks, albeit levels appear similar across the year.
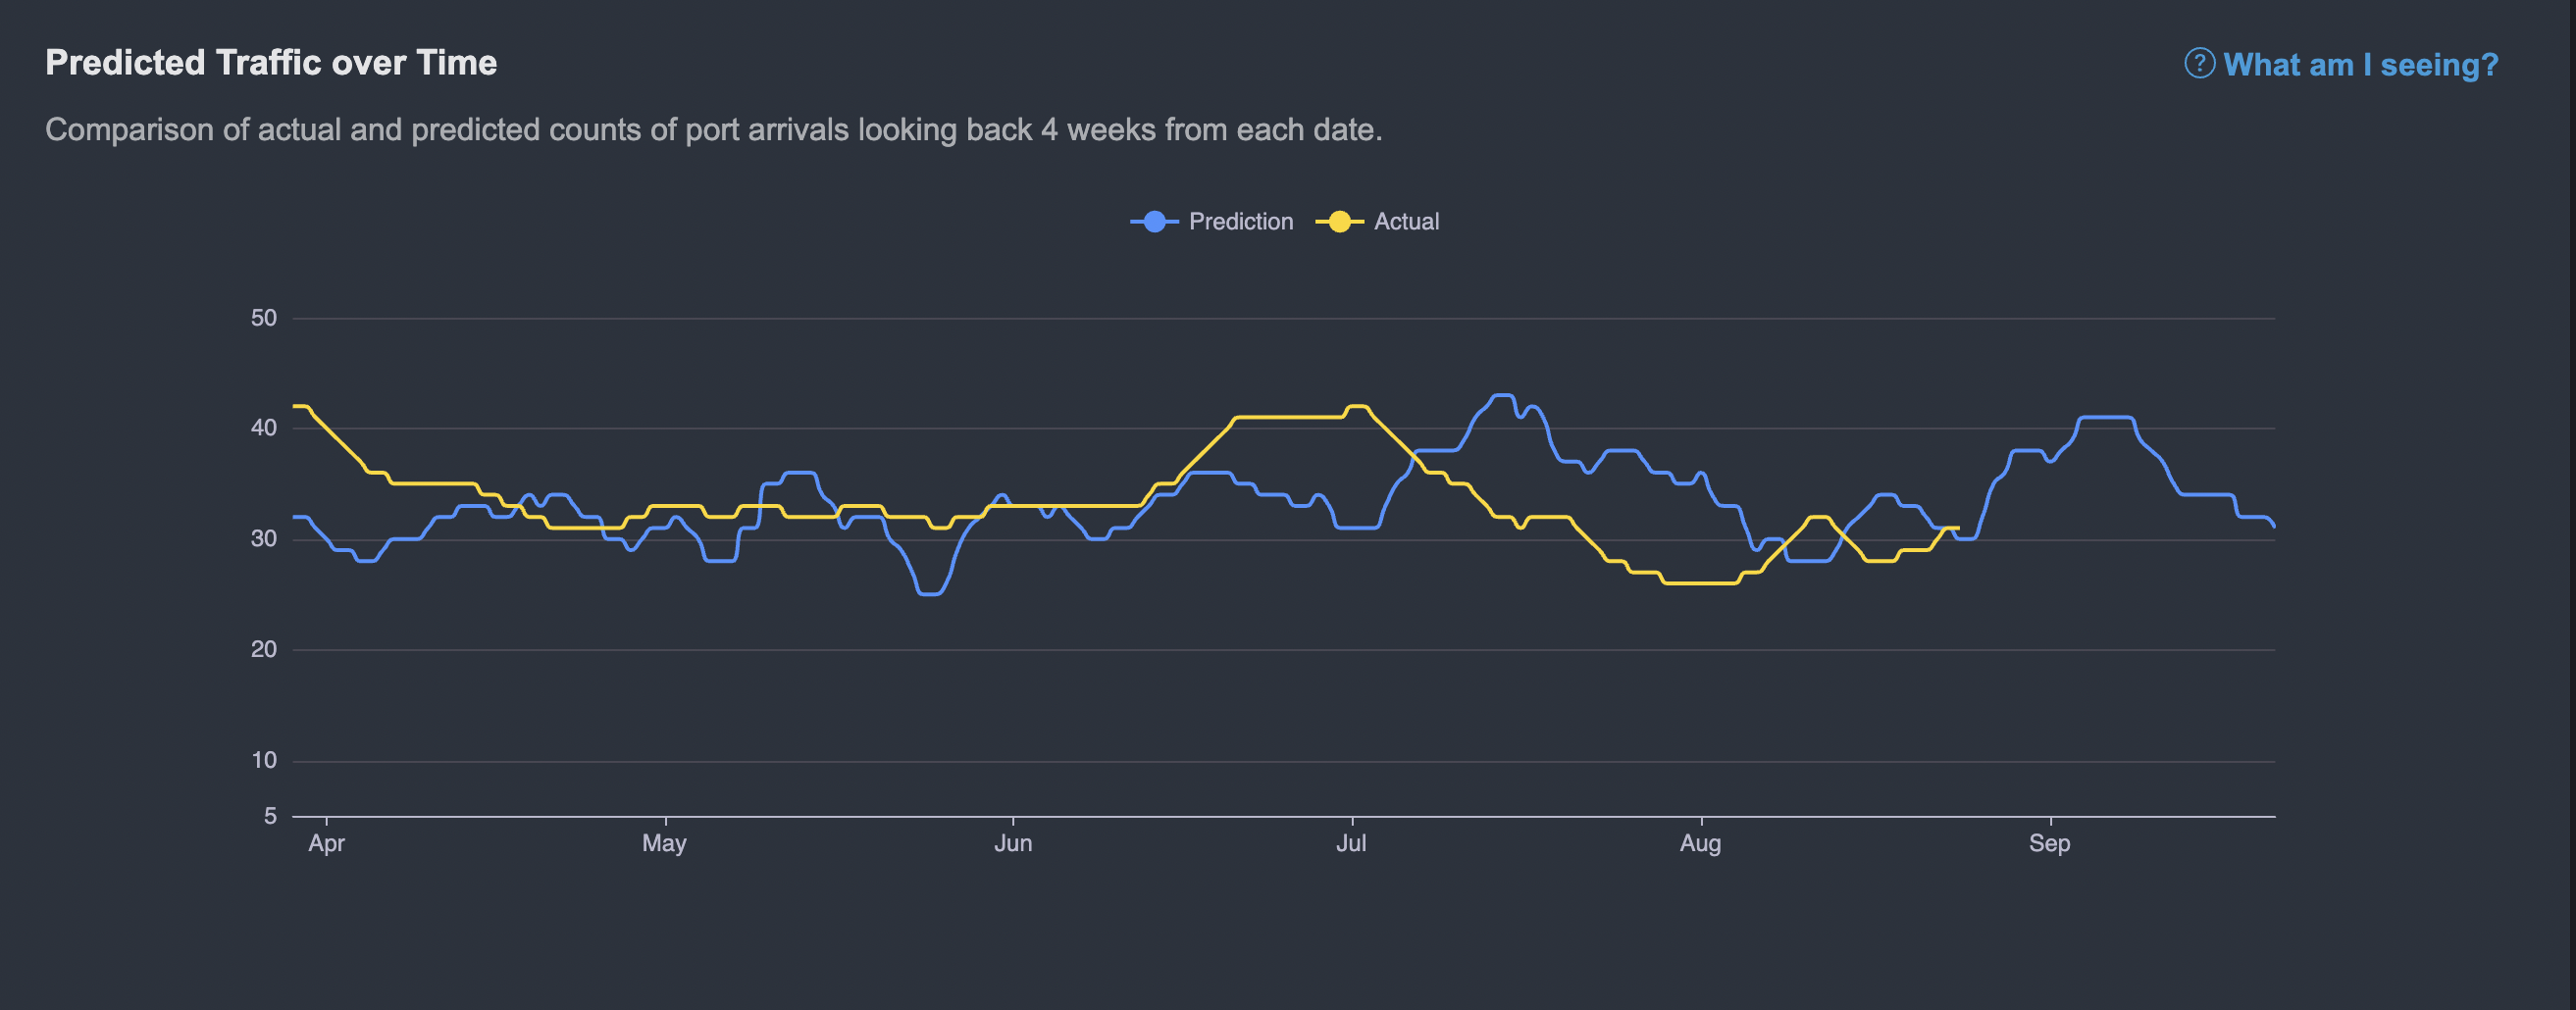
Figure 2 – Rolling 4-week Handysize, Supramax and Panamax arrival predictions for Mesaieed. The yellow line represents actual arrivals versus the blue predictions.
However, what participants interested in the lineup at Mesaieed can do is to access the list of vessels that we have predicted will arrive over the next four weeks. An example of this list for the next four weeks is pictured below.
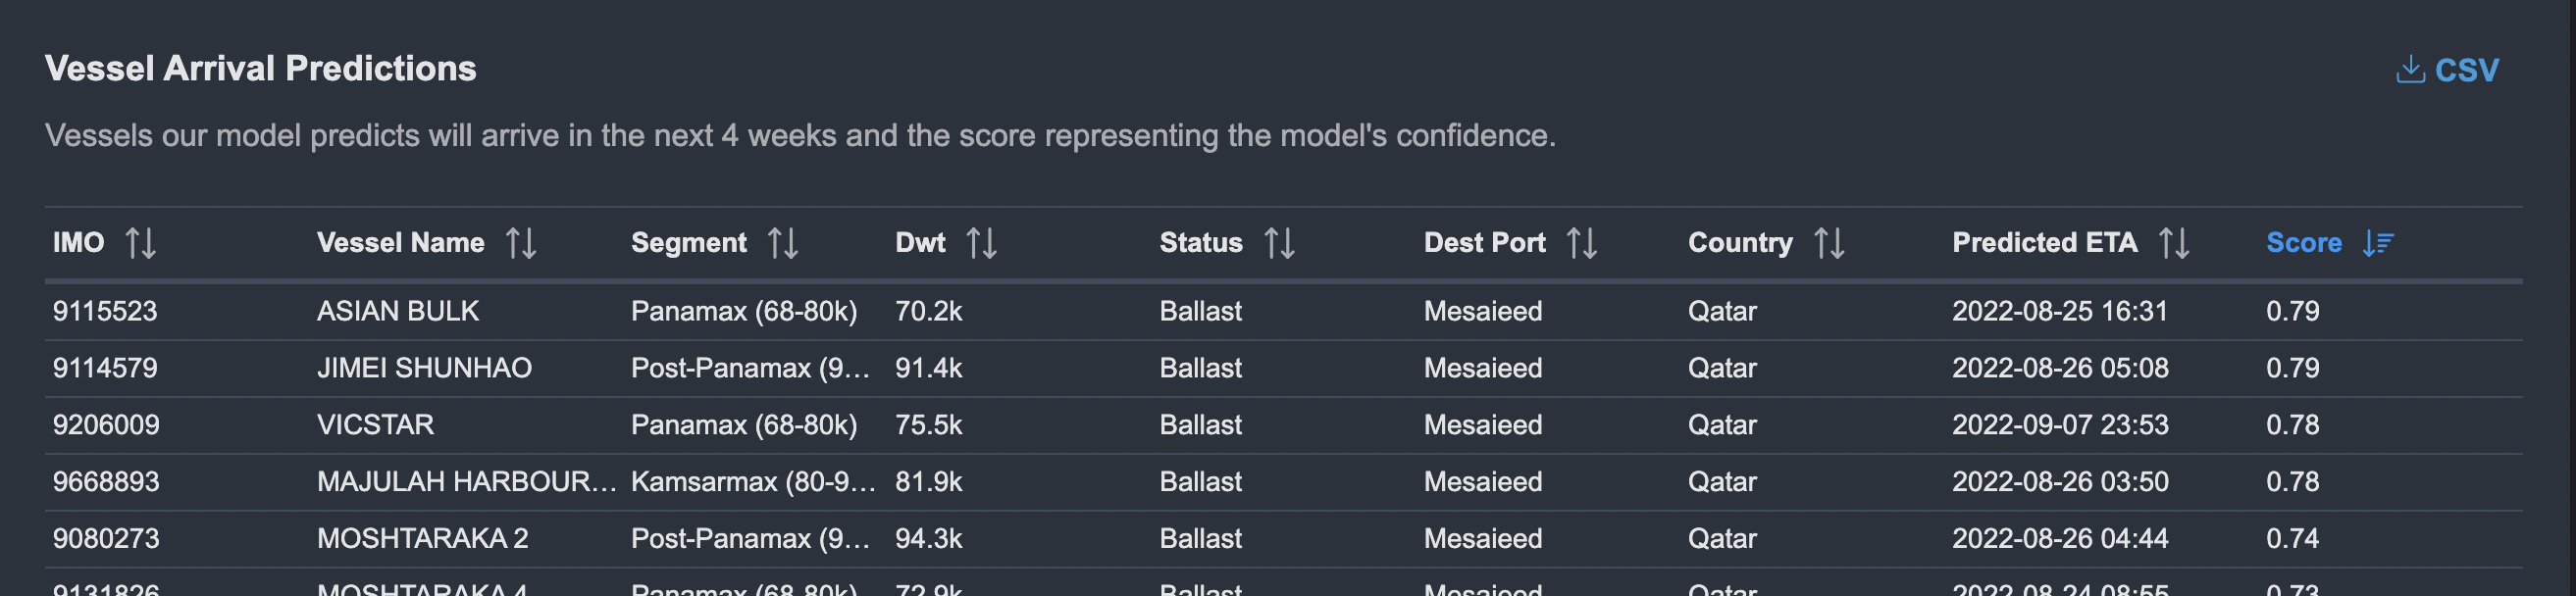
Figure 3 – Handysize, Supramax and Panamax arrival predictions for Mesaieed.
The insights from the model are available via Oceanbolt’s Web App and the raw prediction data by vessel is available via our API. Sign up for a free trial to experience how Oceanbolt can help you make more informed decisions in the freight and commodity markets.