

Veson Nautical recently announced the acquisition of Oceanbolt, a data intelligence platform for the commodity and shipping industries. Oceanbolt provides transparency into the supply chains of sea-borne commodities with a mission to empower commodity and freight professionals to make the best-informed commercial and operational decisions.
Oceanbolt generates its data by combining a best-in-class AIS processing engine with a proprietary geospatial database to provide transparency into the previously opaque movements of commodities. One of the data streams that Oceanbolt generates is congestion insights. Congestion insights refers to the build-up of queues in ports where vessels may wait days, weeks, or months to conduct their operations. By providing insight into these queues, Oceanbolt helps its clients to anticipate supply chain disruptions.
Why congestion visibility matters for supply chain disruptions
Over the past 18 months, we have all observed news headlines of how congestion in the shipping markets have caused disruptions. Whether arising from the Suez blockage, the Port of Longbeach import backlog, or the COVID-related terminal closures in China, congestion is costly to the supply chains which dry up when vessels lay idle. While most news headlines focus on congestion in the container markets, the sea-borne commodity markets have been equally impacted.
Most notably in 2020, a trade war unfolded between China and Australia resulting in a build-up of dry bulk vessels laden with Australian coal. The number of congested vessels peaked in November 2020 with more than 80 vessels congested along the Chinese coastline. The impact was unanticipated, but grave with certain vessels waiting for more than 250 days.
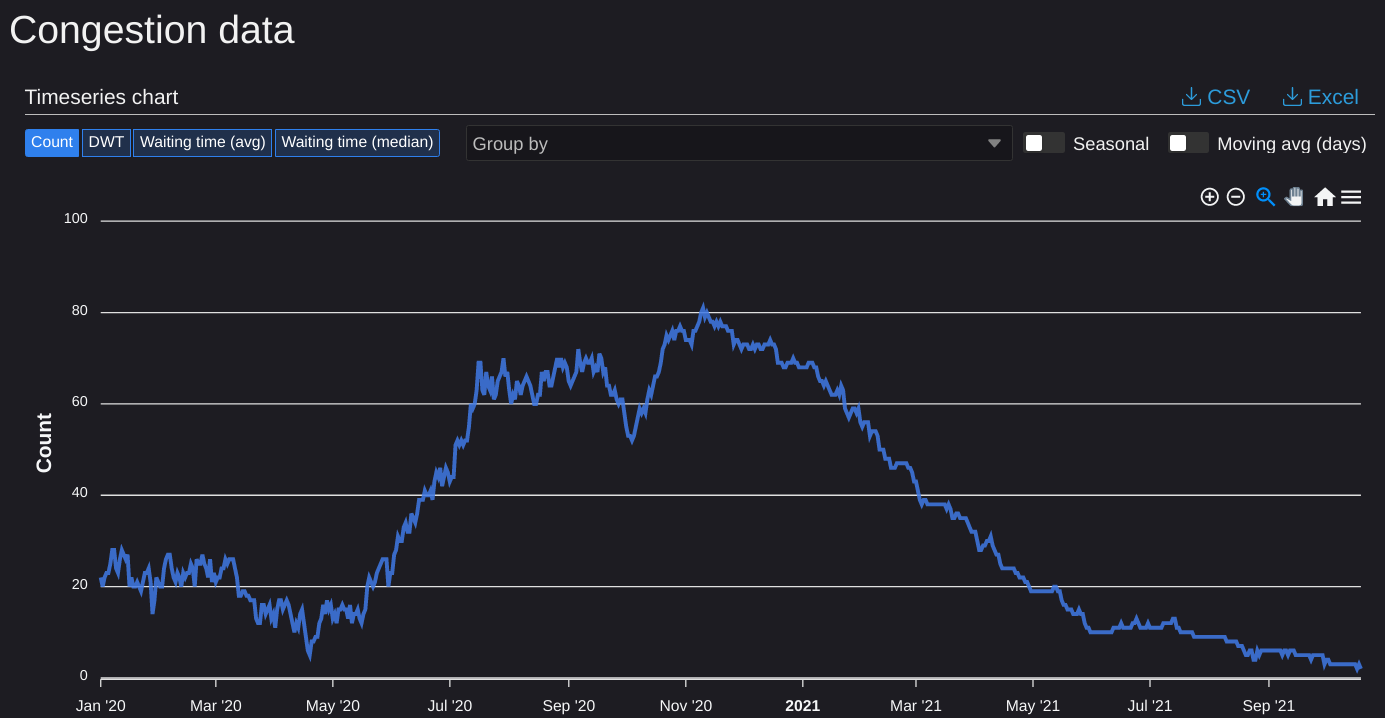
Development of the number of vessels congested vessels in China laden with Australian coal. From Oceanbolt’s congestion insights.
While the chart above illustrates that congestion for vessels laden with Australian coal has eased, the problem of Chinese dry bulk congestion still remains. Since the end of March 2021, the number of congested dry bulk vessels in China has almost doubled to its current level of around 1,000 dry bulk vessels due to a number of factors including typhoon season, COVID-related terminal closures, and a general backlog from the past year of uncertainty. The median waiting time for these vessels is up 23% relative to the same time last year.
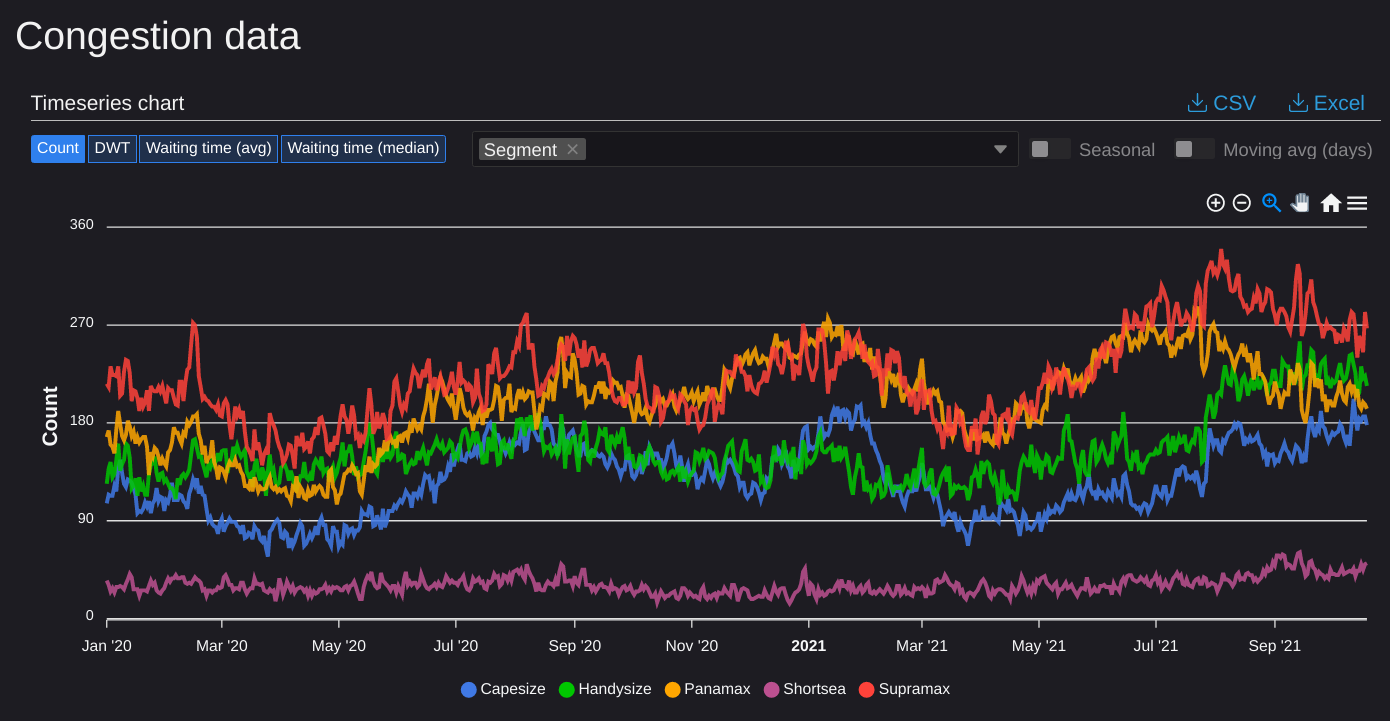
Development of the number of vessels congested dry bulk vessels in China by vessel segment. From Oceanbolt’s congestion insights.
How can Oceanbolt help?
The current Chinese congestion ties up approximately 8% of the global dry bulk fleet. This significant impact is and will continue to cause delays and disruptions in commodity supply chains. Without quantifying and standardizing these metrics, anyone involved in the commodity supply chain would be operating in the blind. This is where Oceanbolt data comes in, providing the right insights, at the right time, in the right way.
For congestion statistics, Oceanbolt provides the right insights by measuring congestion down to the individual port and providing turnaround times for individual terminals and berths. The granularity available in these metrics is facilitated by Oceanbolt’s proprietary geospatial database that contains polygons of every terminal and berth globally. By enabling this level of granularity, Oceanbolt allows its users to gain reliable information around empirically observed waiting times and terminal turnaround times, helping to anticipate supply chain disruptions.
Oceanbolt delivers these insights at the right time by providing a real-time view of the global bulk shipping fleet. Oceanbolt’s best-in-class AIS processing engine ingests the highest resolution of data from satellite, terrestrial, and vessel-mounted AIS receivers and processes this data stream point by point as received. This gives Oceanbolt users a real-time view into the current congestion and vessel operations at any port globally.
The insights from the Oceanbolt platform are delivered in the right way by serving the data via a modern and intuitive web app via a full suite of APIs and SDKs. Oceanbolt clients can explore the data in the web app to quickly form a view on congestion or can choose to dive deep and run advanced analytics (e.g. regressions or machine learning models) by leveraging tools such as Oceanbolt’s Python SDK.
If you are interested in learning more about how Oceanbolt can help you with congestion insights, get in touch with us or request a 3-week non-obligatory free trial of Oceanbolt.
 Veson Nautical
 Philippe Pagnotta