

Welcome to Lesson 2 in our Python SDK learning series. Each lesson is independent, but make sure you check out Lesson 1.
This lesson is about identifying the vessels that serve unique trade lanes only (i.e. every voyage is a new trade lane) and the ones that follow fixed trade lanes (defined as vessels that do not only serve new trade lanes for every voyage). You can follow along in this Jupyter Notebook or read the summary below.
Oceanbolt Python SDK Lesson 2: Unique Trade Lanes by Vessel Segment
In our last lesson, we focused on fleet utilization which is a popular metrics for machine learning-based freight rate prediction models. Using the total number of vessels, however, is somewhat a crude metric as individual vessels may be on long time charters serving a particular charterer or trade lane and therefore should not be counted as part of the spot market’s utilization.
When using AIS data, there is no immediate way of know whether a vessel is employed on a long-term basis, but in this lesson we will apply a proxy metric which will allow us to identify vessels that serve fixed trade lanes for every voyage. The proxy that we will use is to identify whether a vessel serves only one or a handful of trade lanes (i.e. routes) or whether a vessel serves unique trade lanes for every voyage. This is a proxy only, but an interesting analysis. Let us dig in.
Here is a sample of the code from the Jupyter Notebook. You can follow along in the notebook to get a better understanding of the steps.
from oceanbolt.sdk.client import APIClient
    from oceanbolt.sdk.data.trade_flows import TradeFlows
    from oceanbolt.sdk.data.entities import Segments
    from datetime import date
    import pandas as pd

    df = trade_flow_client.get(
    max_results = 20000,
    sub_segment=['vloc'],
    start_date=date(2020, 1, 1),
    end_date=date(2020, 12, 31),
    )

    # We generate our trade lanes (or routes) as a new column.
    df['trade_lane'] = df['load_port_name'] + ' --> ' + df['discharge_port_name']

    # Then sort away incomplete pairs.
    df = df[(df['load_port_id'].notnull()) & (df['discharge_port_id'].notnull())]

    # We count the number of unique trade lanes and total trade lanes by imo
    unique_tl_count = df.groupby('imo')['trade_lane'].nunique()
    all_tl_count = df.groupby('imo')['trade_lane'].count()

    # Let us plot the vessels in a scatter plot.

    tl_counts = pd.concat([all_tl_count_df, unique_tl_count_df], axis=1)
    tl_counts.plot(x='all trade lanes count', y='unique trade lanes count', title='Oceanbolt 2020 Unique Trade Lanes Versus All Trade Lanes', kind='scatter', figsize=(5,5));
As evident from the code snippet, we are only investigating the VLOC fleet in this example.
Running the code above, we obtain the following chart:
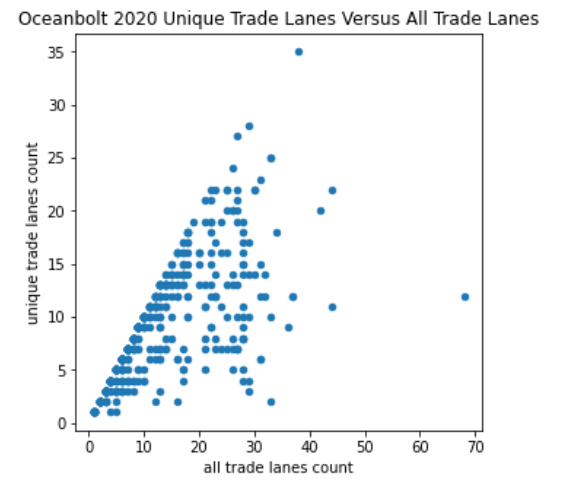
So certainly for the VLOC fleet, there are a large proportion of the vessels that have only taken unique routes, but let us quantify this metric (again using Python). Note that we are introducing a strong assumption by counting only vessels that have served only unique trade lanes in 2020. This implies a unique voyage to total voyage count of 1.0.
tl_counts['proportion unique'] = tl_counts['unique trade lanes count'] / tl_counts['all trade lanes count']
  unique_only = tl_counts['proportion unique'][tl_counts['proportion unique'] == 1.0].count()
  fraction_unique_only = unique_only / tl_counts['proportion unique'].count()
  fraction_unique_only
We see that 45% of the VLOC fleet served only unique trade lanes (routes) for all their voyages in 2020. Arguably, this metric is rather crude and can be improved in several ways. Importantly, it does not take into account the total number of voyages by vessel, meaning that a new built vessel from Sep 2020 with only one voyage in 2020 will be counted as all unique.
Check out the Jupyter Notebook to see what the vessel with the smallest proportion of unique routes is (spoiler: in 2020 it spent all year carrying iron ore from Australia to Hyandai Steel’s plant in Pyeongtaek).
While the notebook only contains the code for the VLOC segment, we ran the code across all the DWT 10k+ sub-segments to generate the chart below.
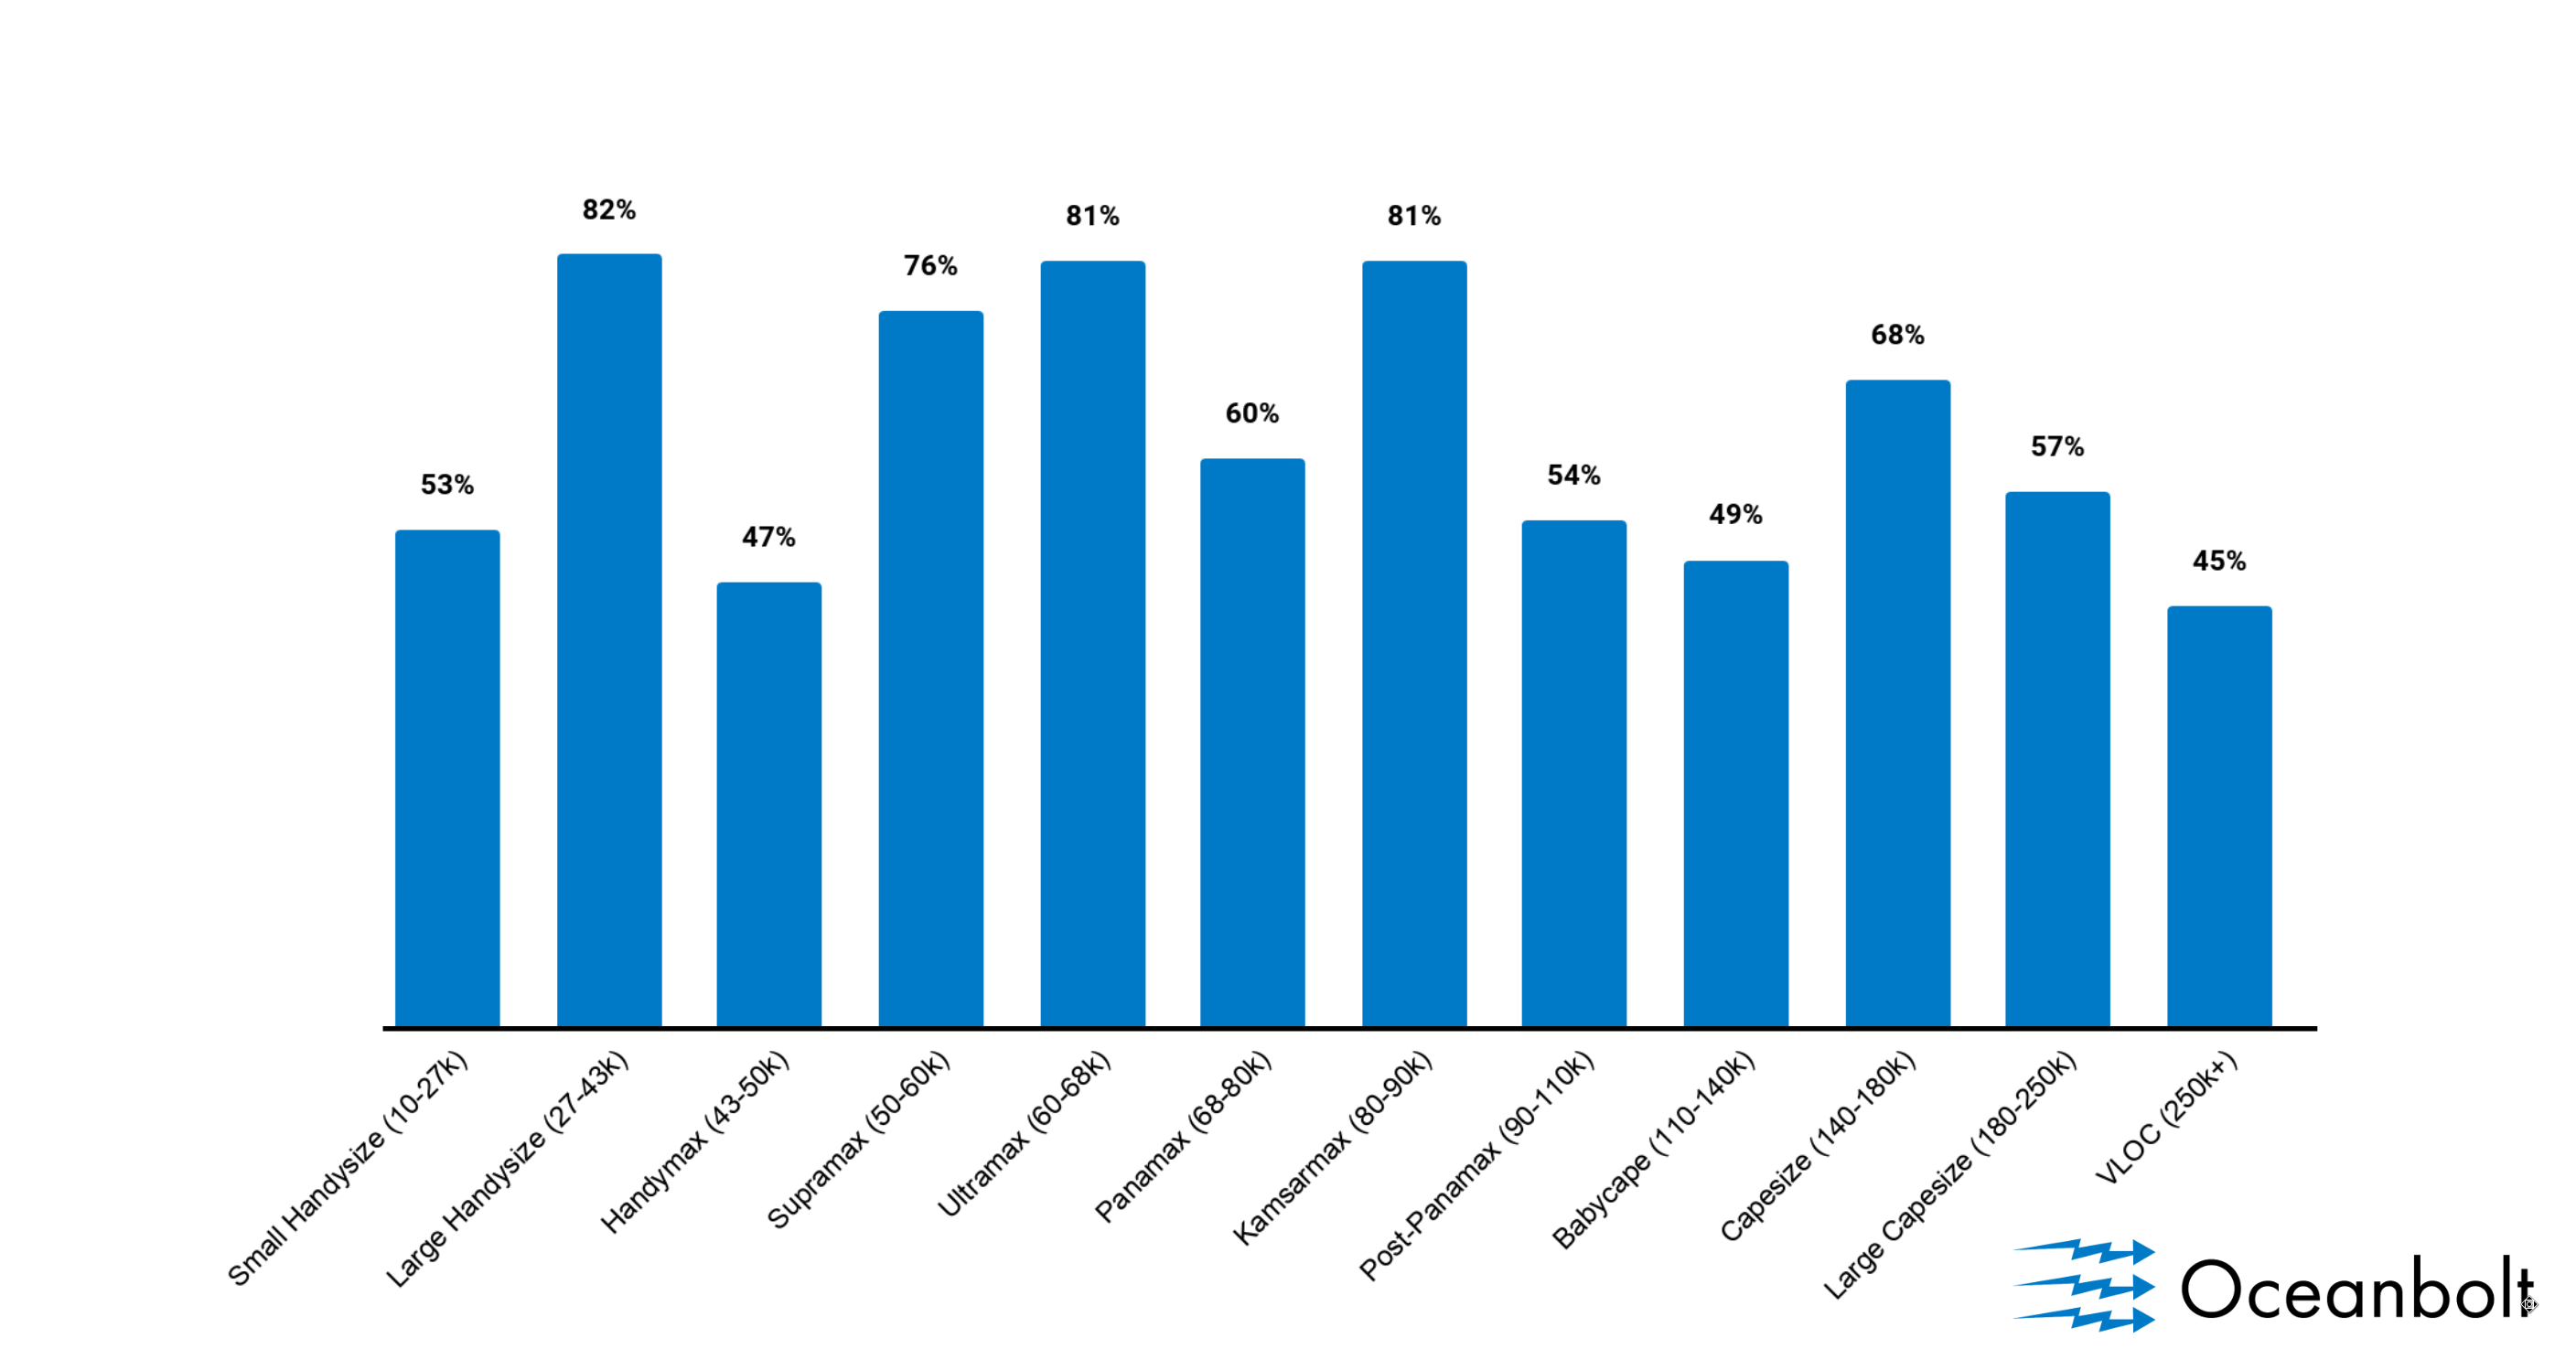
This is an interesting chart, illustrating what fraction of the fleet that in 2020 served unique trade lanes only (i.e. they did not serve the same port pair twice in 2020). This is arguably a strong assumption and a data scientist or research analyst would want to test different fractions of unique trade lane proportions for their counts. Nonetheless, it is no surprise that the VLOC segment has the lowest proportion of vessels that serve unique trade lanes only.
Thanks for reading this! If you are interested in getting access to our data, sign up for a product demo and stay tuned for future lessons!