

Welcome to Lesson 4 in our Python SDK learning series. Each lesson is independent, but make sure you check out Lesson 1, Lesson 2, and Lesson 3.
This lesson is about tracking dry bulk commodity flows at the berth or terminal level. You can follow along in this Jupyter Notebook or read the summary below.
Oceanbolt Python SDK Lesson 4: Vale’s iron ore exports from Ihla Guaíba
On Thursday, April 22, 2021, Vale reported that their operations at Ihla Guaíba had been halted by the Mangaratiba City Government in Rio de Janeiro over an environmental licensing issue. Vale did announce that operations resumed, so the disruption was minor.
Yet, the Ihla Guaíba terminal is an important terminal for the iron ore market being among the top 10 largest iron ore exporting ports in 2020. Given its importance, we demonstrate how to track terminal level flows using our SDK.
Here is a sample of the code from the Jupyter Notebook. You can follow along in the notebook to get a better understanding of the steps.
from oceanbolt.sdk.client import APIClient
    from oceanbolt.sdk.data.trade_flows import TradeFlowTimeseries
    from datetime import date

    #More code to initialize the trade_flow_client with an API token (check out the Jupyter Notebook for details)

    df = trade_flow_client.get(
    frequency="daily",
    load_berth_id = [5923], #The Oceanbolt Berth ID as discovered by using https://app.oceanbolt.com/
    commodity_group=['iron ore'],
    start_date=date(2021, 4, 1),
    end_date=date.today(),
    exclude_intra_country = True
    )

    #Let's plot the timeseries
    df.plot.bar(x='date',figsize=(10,5), title='Daily Iron Ore Exports from Vale\'s Terminal in Ilha Guaíba');
Running the code above, we obtain the following chart:
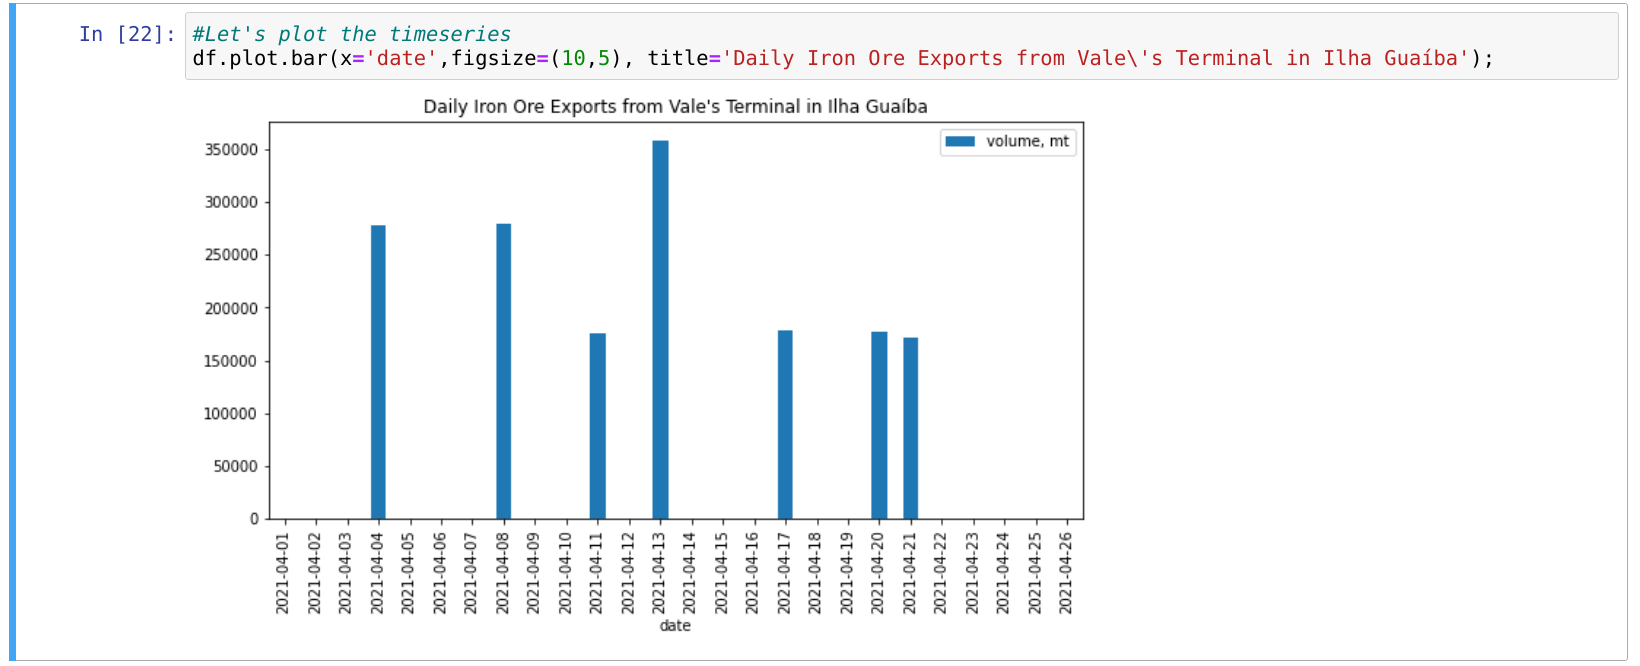
What the chart above does not reflect, is that the 300k DWT Capesize vessel, COSCO ANSTEEL, entered the berth on April 23 and is currently loading before it is expected to set course for Qingdao, China.
Vale stated in their press, release that they exported 60k metric tonnes of iron ore during 1Q21, let us check our data to confirm the numbers:
df_1q = trade_flow_client.get(
      frequency="daily",
      load_berth_id = [5923], #The Oceanbolt Berth ID as discovered by using https://app.oceanbolt.com/
      commodity_group=['iron ore'],
      start_date=date(2021, 1, 1),
      end_date=date(2021, 3, 31),
      exclude_intra_country = True
      )
    print("Vale exported " + "{:,}".format(df_1q['value'].sum())+" metric tonnes of iron ore from Ilha Guaíba in 1Q21")
    print("The average daily export from Vale\'s terminal in Ilha Guaíba was " + "{:,}".format(df_1q['value'].mean())+" during 1Q21")
So rightly, this code prints that Vale exported 5,369,400 metric tonnes of iron ore from Ilha Guaíba in 1Q21 and that the average daily export from the terminal was 59,660 metric tonnes during 1Q21.
Thanks for reading this! If you are interested in getting access to our data, sign up for a product demo and stay tuned for future lessons!