
This is a regularly updated blog of Veson analysis related to ongoing developments in the Strait of Hormuz. Last updated May 12, 2026
Venezuelan Crude Exports: A 2026 Rebound
By Rebecca Galanopoulos | May 28, 2026
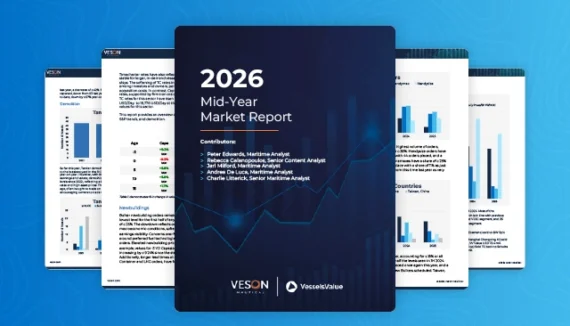
Venezuelan dirty petroleum trade volumes surged dramatically in early 2026, ending years of near-flat activity. Using VesselsValue and Oceanbolt data, we can see this sharp rise more clearly as the country’s line hugged close to zero throughout 2022-2025.
The spike reflects a significant geopolitical shift. A US-led blockade of sanctioned Tankers servicing Venezuelan crude exports in late 2025 had choked off shadow flows, suppressing volumes to negligible levels. A change in Venezuelan government in early 2026 and the subsequent easing of that blockade created the conditions for a rapid export rebound, with previously accumulated stocks clearing quickly once legitimate trade licences were issued to major traders.
With Iranian exports constrained by sanctions and uncertainty around Hormuz limiting Persian Gulf flows, US Gulf Coast refiners, configured to handle heavy sour crude, have had a clear incentive to turn to Venezuela as an alternative supply source, adding further momentum to the rebound. Notably, the US has reclaimed its position as the primary individual destination for Venezuelan crude, displacing China, which had been the dominant buyer throughout the sanctions period.
The recovery is visible not just in trade volumes but in the dark fleet data. Venezuelan-owned vessels account for just 20 of the 831 total dark fleet Tankers tracked, a relatively modest figure that points to Venezuelan crude increasingly moving through compliant channels rather than shadow operators as the sanctions environment normalised.
Hormuz Closure Slows Down the Dry Bulk Fleet
By Mikkel Nordberg | May 12, 2026
Despite the macroeconomic uncertainty stemming from the conflict in the Strait of Hormuz, the dry bulk sector has benefited from the upheaval. Dry bulk freight rates have surged to levels not seen for this time of year in recent history. The culprit, paradoxically, are the rising fuel prices that have upended much of global trade. Soaring fuel prices have pushed shipowners to slow their vessels, tightening the supply of available tonnage just as commodity demand remains elevated. The result is a market that is defying conventional wisdom.
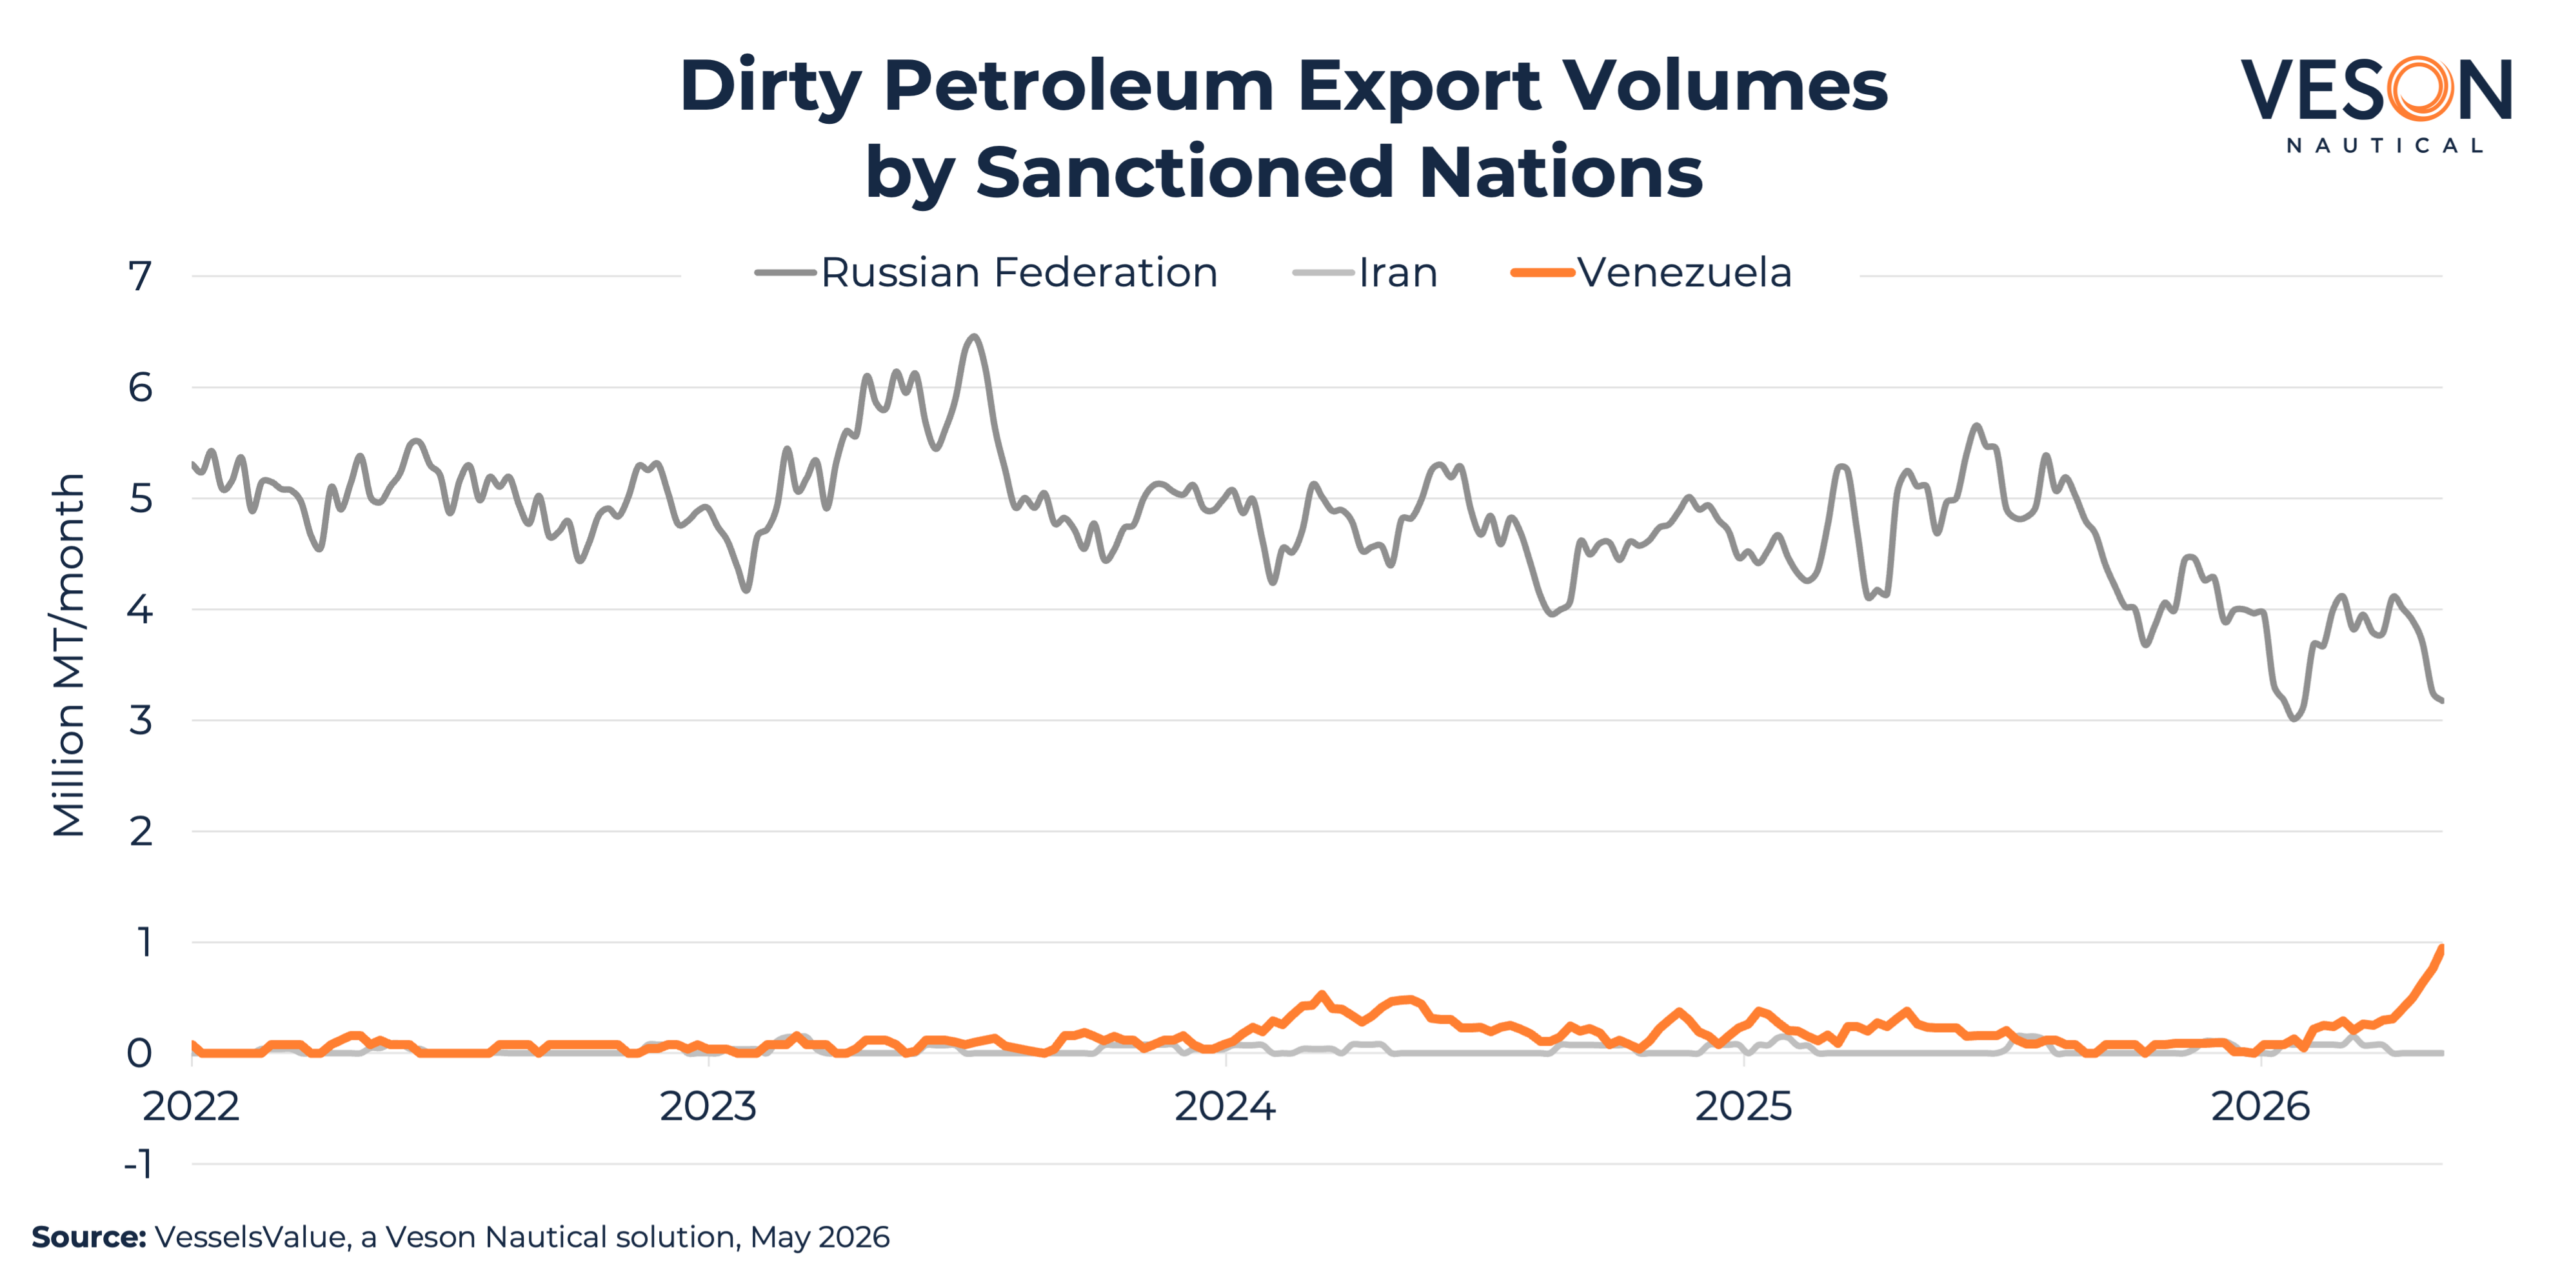
At the time of writing, Capesizes are steaming ahead towards new near-term records with freight rates above 40,000 USD/day. China is a key demand driver — Chinese imports of iron ore and bauxite increased by 10% and 28% respectively in Q1, with a growing portion of these cargoes travelling increasingly longer distances. Meanwhile, coal demand is also up, as high gas prices and energy security concerns are driving coal switching, further supporting dry bulk freight rates.
The surge in oil prices is also buoying the tight market balance. The price of Very Low Sulphur Fuel Oil (VLSFO) in Rotterdam has nearly doubled since the onset of the conflict, rising from 480 USD/t to 800 USD/t. Since fuel represents the single largest operating cost for a vessel, shipowners have responded by slowing down their fleets to reduce consumption. The Capesize fleet is currently sailing 0.31 knots below pre-closure levels, a reduction of 2.7%. This slow steaming is straining the available supply of vessels, even as demand remains elevated.
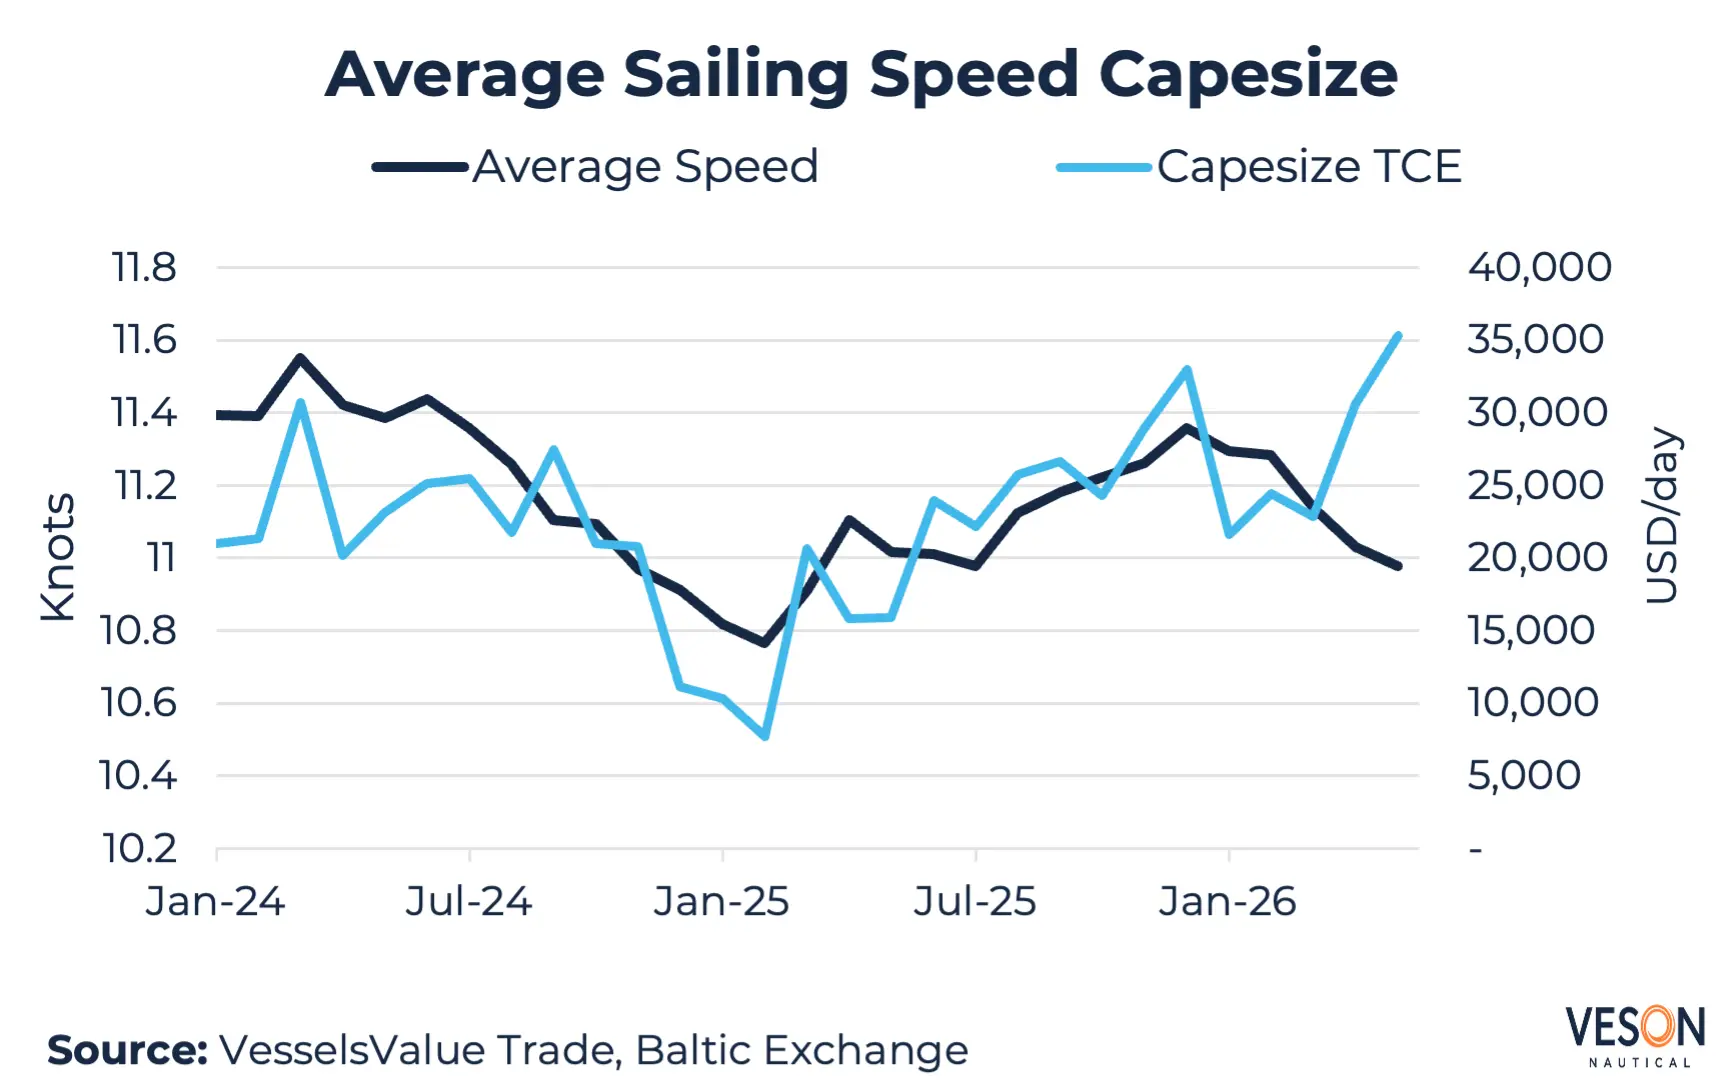
Typically, the dry bulk fleet speeds up during periods of high demand and elevated freight rates, as vessels rush to position for the next cargo. This increases the supply of available tonnage, eases some of the pressure from demand shocks, and moderates the rise in freight rates. As a result, sailing speeds and freight rates tend to move in tandem and have historically shown a strong positive correlation.
However, the sudden surge in fuel prices has broken this relationship. According to VesselsValue Trade data, the correlation between freight rates and sailing speeds averaged at 0.74 between 2020 and 2025, reflecting a strong positive relationship. In 2026, this has inverted completely to a strong negative correlation of -0.88. Freight rates and sailing speeds are now moving in opposite directions, marking a significant structural shift in market behavior and causing above average market peaks.
Forward Markets Paint a Rosy Picture for Dry Bulk
By Mikkel Nordberg | April 29, 2026
While the situation in the Middle East remains uncertain amid stalled peace talks and the continued closure of the Strait of Hormuz, the dry bulk segment is still largely unscathed. Spot freight rates remain solid across all dry bulk segments, and the ongoing ceasefire has breathed new life into the bulker market.
The coal trades in particular may benefit from the closure of the strait. Scarcity and elevated prices in oil and gas markets will likely lead to coal switching, with countries seeking to increase coal consumption to reduce pressure on energy prices. This effect will likely be most prominent for as long as the strait is closed. That said, the past two months have highlighted the risks of a world reliant on the Strait of Hormuz for its energy supplies. The coal switching trend could therefore prove more enduring, providing lasting support to dry bulk markets.
There is, however, one significant downside to the closure of the strait for dry bulk markets. A prolonged period of a closed strait and elevated energy prices could be detrimental to economic activity and potentially tip the global economy into a recession. Since dry bulk demand is closely tied to economic growth, a recession would be unambiguously negative for dry bulk freight markets. Fertilizer shortages could reduce upcoming grain harvests, which would in turn lead to a decline in grain trade and weigh on dry bulk freight rates.
Whether the positives outweigh the negatives depends entirely on the duration of the situation — the longer the closure persists, the more severe the negative effects become. Currently, however, the FFA market appears convinced that the positives have the upper hand. Since the ceasefire began and hopes of economic normalization emerged, dry bulk FFA markets have remained broadly positive. The market is expecting Capesize rates above 30,000 USD/day for the remainder of the year, with small and medium sized segments expected to trade largely in line with current spot rates.
This outlook implies a near-term resolution to the situation in the Strait of Hormuz and a world economy that avoids recession. Should this scenario fail to materialize, however, the reality could prove significantly worse than what the current FFA curve suggests.
Speed as a Signal: What Tanker Behaviour Tells Us About the Hormuz Disruption
By Graham Close | April 16, 2026
Since the US-Israeli conflict closed the Strait of Hormuz, VesselsValue speed data is showing a striking divergence between how VLCCs and Suezmaxes are responding — and the contrast tells two very different stories.
Average Suezmax ballast speeds have reached the highest level in VesselsValue data going back to 2012, surpassing even the COVID-era floating storage boom.
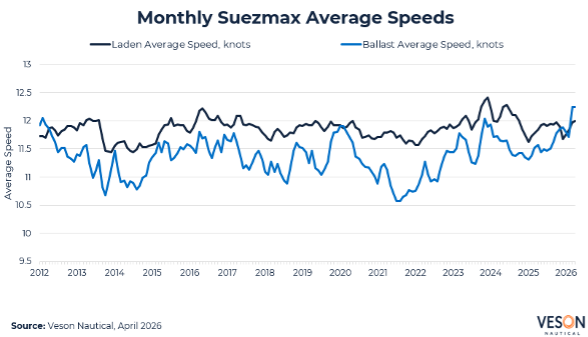
Laden speeds, however, remain below the peaks of late 2023/early 2024 during the Cape of Good Hope diversions. The fleet isn’t racing to deliver existing cargoes — it’s relocating at record pace toward alternative load zones, and with West Africa, the Americas and the Black Sea all accessible, it has somewhere to go.
VLCC laden speeds have spiked to their highest point since 2016, exceeding both the post-COVID and Cape diversion peaks — vessels that loaded before Hormuz closed are racing to deliver into a backwardated market.
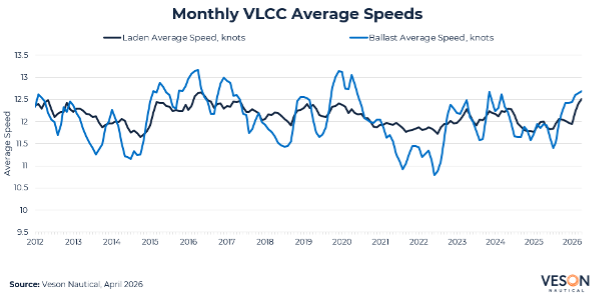
Ballast speeds have also risen this year, though unlike Suezmaxes they haven’t reached record highs. VesselsValue vessel tracking shows the ballast fleet simultaneously routing via Yanbu, along the Cape, toward West Africa and into the Americas. The fleet has dispersed globally all at once, across vastly different voyage stages, which is why the aggregate doesn’t spike as cleanly.
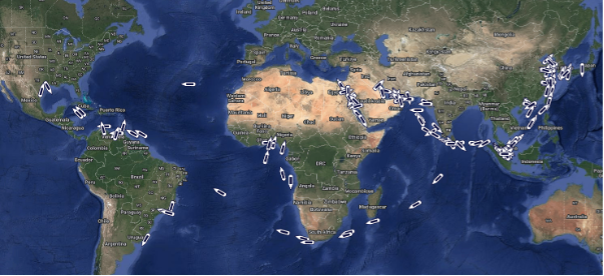
The Suezmax signal is unambiguous — a fleet converging on alternative load zones at record speed. For VLCCs, the speed data alone understates the activity. The real story is in the map: a fleet that has scattered in every direction simultaneously rather than waiting. As the pipeline of pre-conflict Gulf loadings works through the system, whether those dispersed ballast VLCCs secure cargo at scale from alternative load zones will be the number to watch.
Strait of Hormuz Traffic Far Below Normal Three Days into Ceasefire
By Graham Close | April 10, 2026
Traffic through the Strait of Hormuz remains far below normal levels, indicating that owners and operators are still unconvinced about both the safety and durability of the two‑week ceasefire.
Before March 2026, well over 100 vessels per day routinely transited the Strait.
Since the ceasefire began, Veson AIS analysis shows only 12 outbound non‑Iranian‑linked vessels and 4 inbound non‑Iranian‑linked vessels
This represents a more than 90% collapse in non‑Iranian commercial transits compared with pre‑crisis norms.
Major energy companies, commodity traders, and shipowners are deliberately keeping tonnage away from the region due to the risk of vessels becoming stranded if hostilities resume. Saudi Aramco has stated it is only tendering Ras Tanura Crude Liftings for May onward, and COSCO Shipping has told investors it does not plan to restore Middle East Gulf port calls on the basis of the current ceasefire.
Overall, vessel behaviour suggests the market views the ceasefire as fragile, with operators prioritising fleet safety and optionality over early re‑entry into the Gulf.
How the US-Iran Ceasefire Could Impact Vessel Movement
By Rebecca Galanopoulos | April 8, 2026
The two-week US-Iran ceasefire announced today has introduced a significant shift in market sentiment. Iran agreed to resume limited shipping access through the Strait of Hormuz, partially restoring a corridor through that has been disrupted since late February. With Tankers accounting for the largest share of the backlog, representing 39% of all vessels currently positioned in the inner Persian Gulf, the crude market stands to be the most immediate beneficiary of any sustained reopening.
With S&P activity largely in a wait-and-see holding pattern during the closure, the ceasefire may prove sufficient to draw buyers and sellers back to the table, even if only tentatively, as the market digests what a partial reopening means for long-term fleet economics.
Veson Nautical data highlights the scale of the backlog, with 1,019 vessels currently positioned in the inner Persian Gulf across all major segments. Tankers account for the largest share at 396 vessels totalling 36.3 mil DWT, followed by 197 Bulkers at 12.0 mil DWT and 106 container vessels at 359,706 TEU. LPG and LNG carriers, 37 and 17 vessels respectively, represent a combined 4.3 mil CBM of gas export capacity effectively idled in the region.
The implications extend beyond crude Tankers. LNG and LPG carriers, which had seen freight elevated by Gulf export disruption and tonnage displacement, may face a softening in the near term. Bulkers and Container vessels, while less directly exposed, had been carrying war-risk insurance premiums and facing indirect rerouting costs that should begin to ease.
Across all segments, however, operators will remain cautious. The passage opening is conditional on coordination with Iranian forces. Peace talks are only beginning in Islamabad on 10 April and the ceasefire window is two weeks. Until a more solid agreement is confirmed, any resumption of transactional activity is likely to be tepid, rather than a signal of a broader market reset.
Are Long‑Haul Crude Flows Expanding? March Tonne‑Miles Drop Amid an Upending Market
By Graham Close | April 2, 2026
March was not a normal month for oil markets. The US-Israeli strikes on Iran and ensuing de facto closure of the Strait has dramatically impacted the month’s tonne-mile data.
Against that backdrop, the scale of the decline is perhaps less surprising than the question it raises: what does it tell us about where crude flows go from here?
Across Aframax, Suezmax, and VLCC segments, total tonne‑miles fell 13.7% year‑on‑year in March, and ‑16.4% when normalised by the live fleet — lower than anything recorded during the COVID-19 pandemic.
VLCCs are the primary vessel for Persian Gulf crude exports, so the Hormuz closure hit them hardest. Total VLCC tonne‑miles fell 20% YoY, and ‑27% per vessel. That per-vessel figure strips out any flattering effect from fleet growth, as it shows existing tonnage going largely unused as Gulf liftings collapsed.
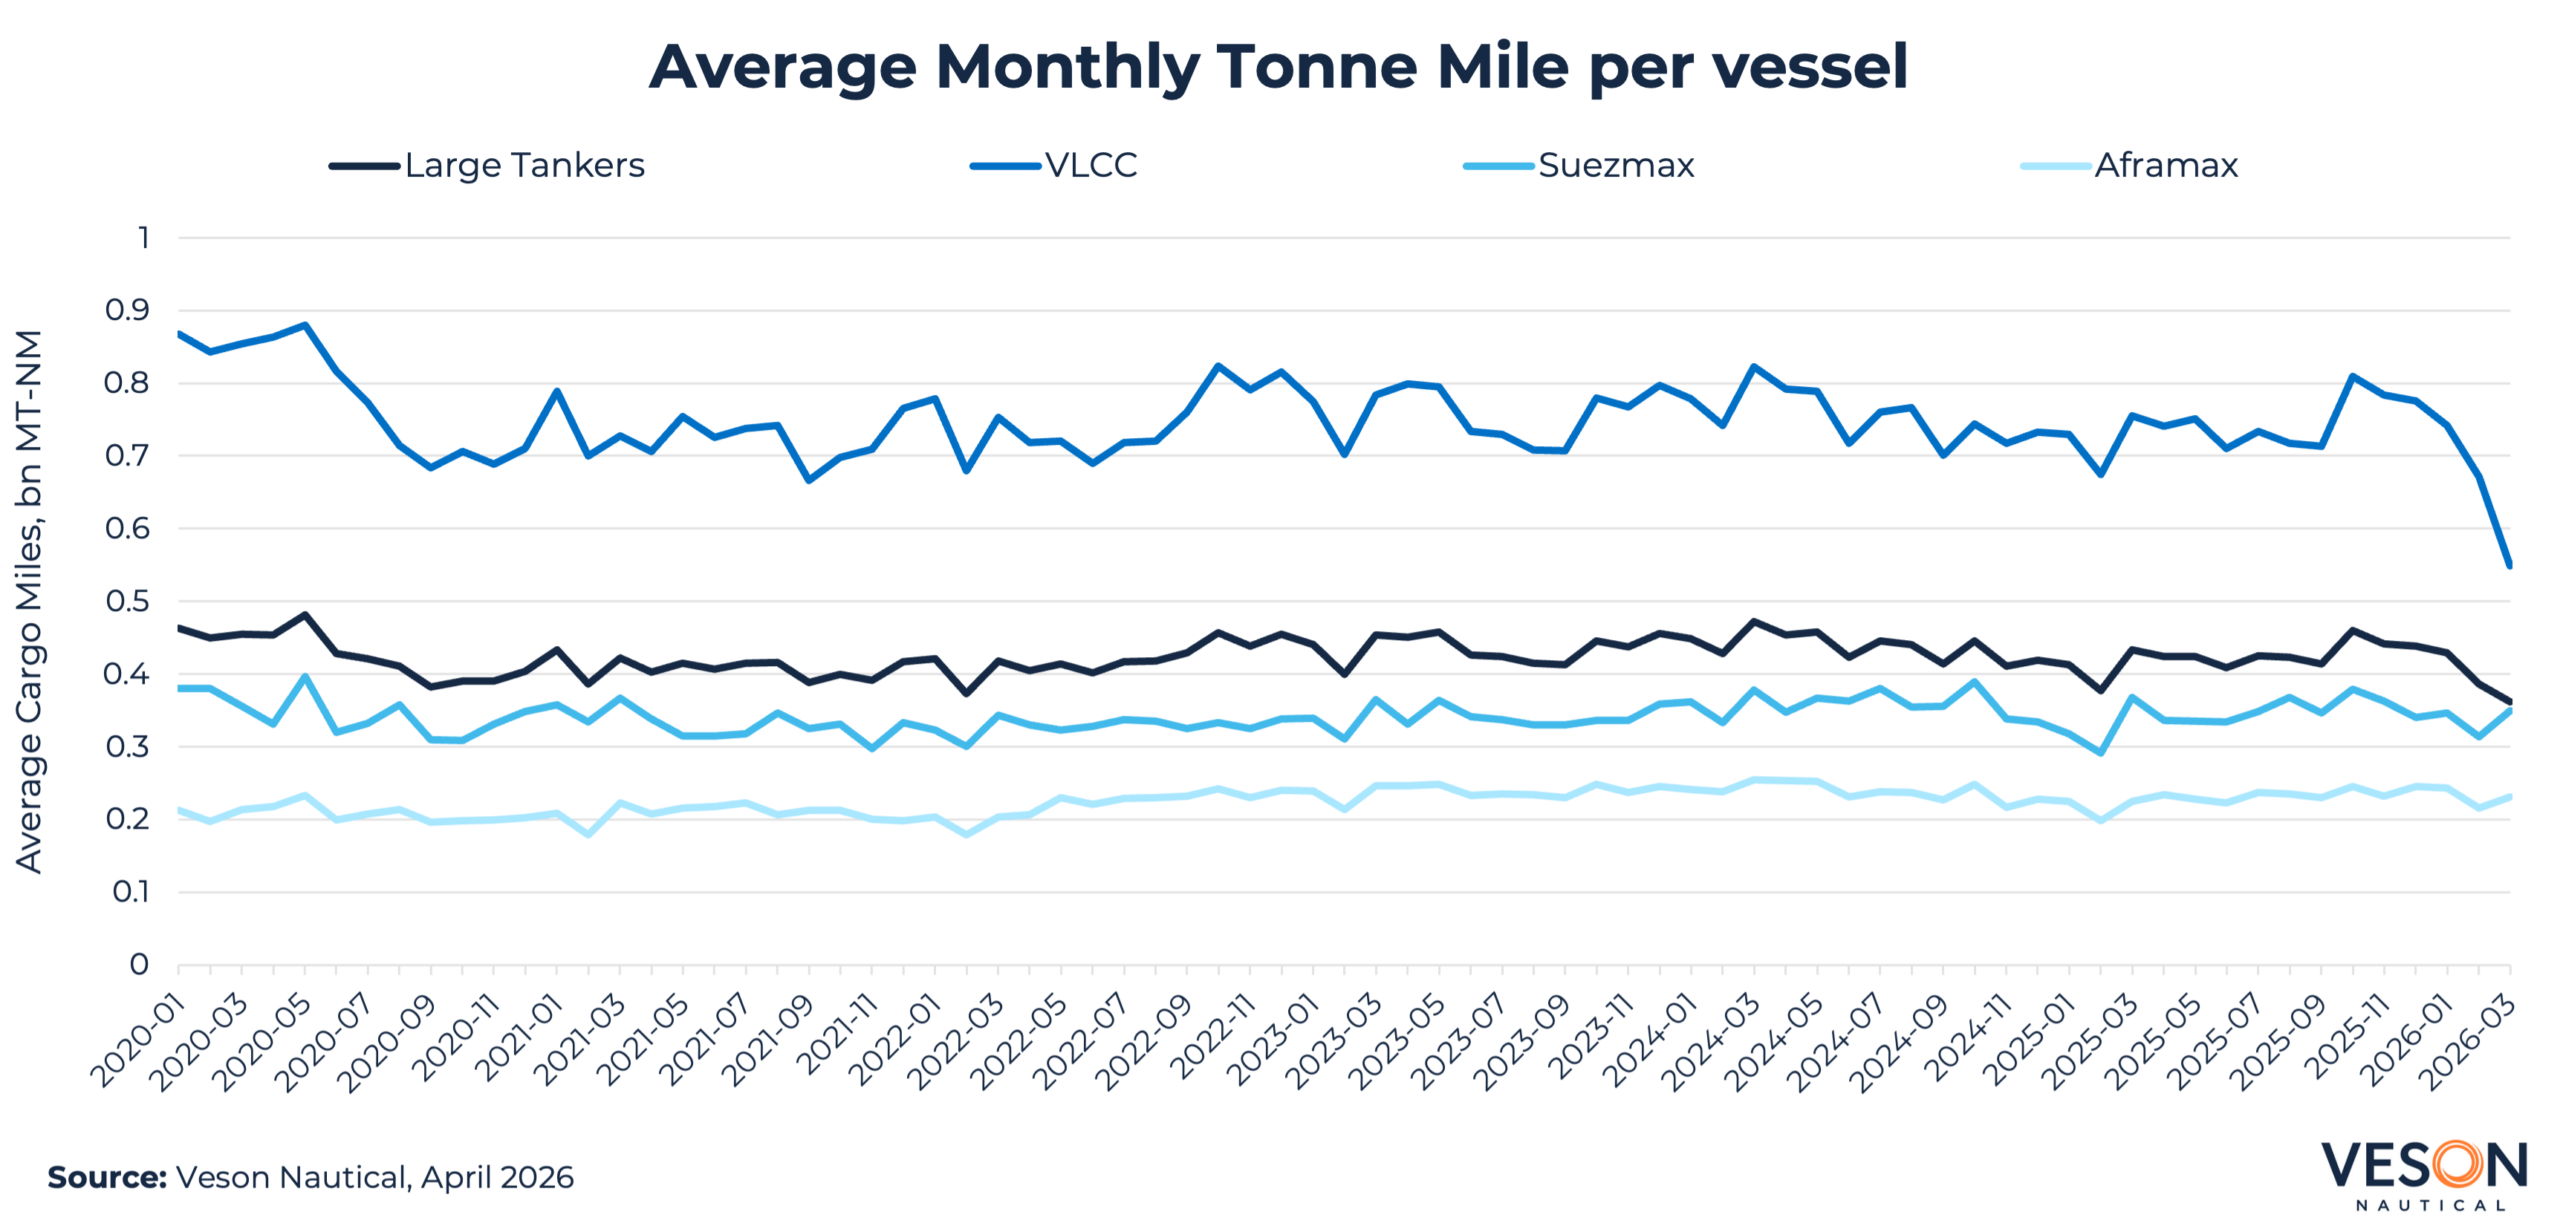
Aframax tonne‑miles were actually up 7% YoY (+3% per vessel), while Suezmax was broadly flat at ‑1% YoY (‑5% per vessel). This likely reflects non-Gulf trade routes continuing to function — shorter and medium-haul flows that don’t depend on Hormuz transit.
Before the war, there was growing discussion about Asian refiners reaching further into the Atlantic Basin for crude — a trend that, if real, should eventually show up as rising VLCC tonne‑miles on long-haul routes. March can’t tell us whether that was happening, because the Hormuz closure overwhelmed any such signal.
April is the first month where we might start to see whether Asian refiners are genuinely compensating for lost Gulf supply by pulling harder from the Atlantic. If they are, VLCC tonne‑miles should begin to recover — and on longer average voyage lengths than before. If they don’t, it would suggest either that alternative supply isn’t flowing at the scale the narrative implies, or that demand destruction is offsetting any rerouting effect.
March tonne‑miles tell us the market absorbed a significant shock. What they can’t yet tell us is how trade flows are adapting to it.
A Fifth of the World’s Offshore Vessels are at Risk in the Persian Gulf
By Peter Edwards | March 25, 2026
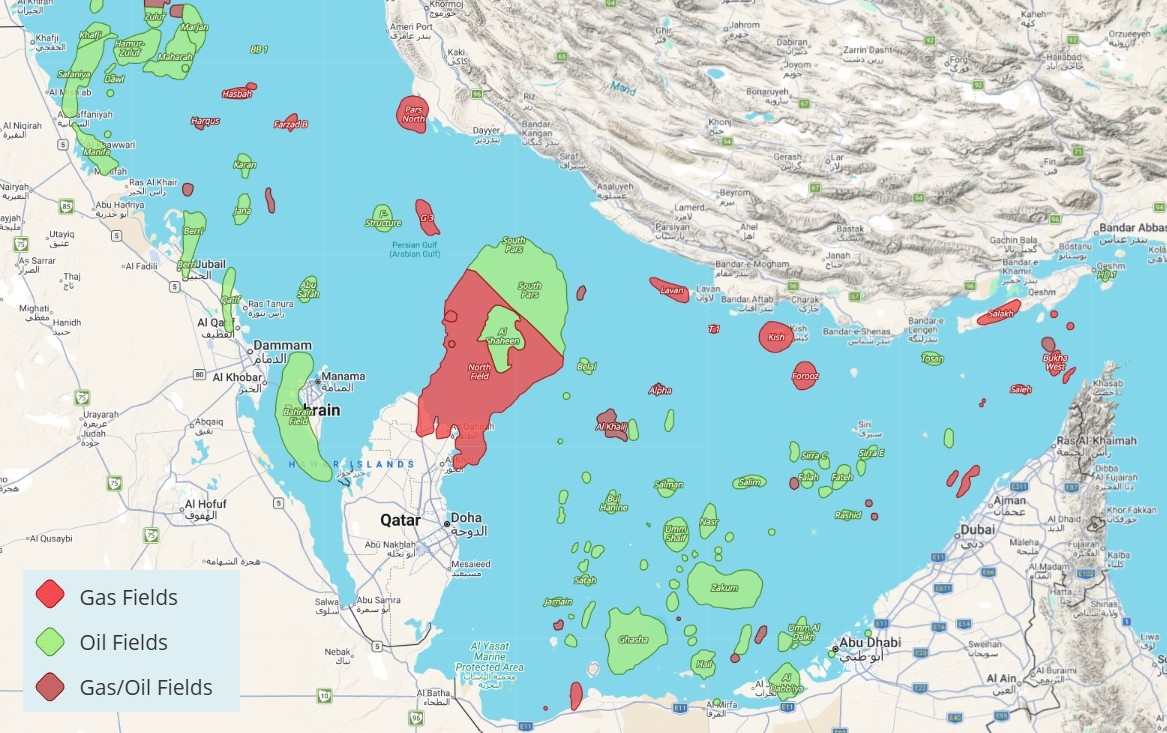
The Middle East conflict has delivered an immediate shock to the offshore market. Saudi Aramco, QatarEnergy, Kuwait Petroleum and ADNOC have all reduced, suspended or declared force majeure on production, with Gulf oil exports falling over 60% to around 9.7 million barrels per day for the week ending March 15. The closure of key offshore fields including Safaniya, the world’s largest offshore oil field, alongside Marjan, Zuluf and Abu Safa has contributed to an estimated 2 million to 2.5 million barrels per day reduction in Saudi production.
QatarEnergy has also shut down all gas production at its offshore North Field in the Persian Gulf and declared force majeure. With repairs to the Ras Laffan LNG terminal expected to take up to five years, it puts one of the region’s most significant long-term OSV and OCV demand programmes on hold. OSVs and OCVs supporting drilling, logistics, subsea and field maintenance across the region are now without active operations and with no clear timeline for resumption.
The scale of the fleet exposed to disruption is also significant. The region currently hosts 1,440 OSVs, 432 OCVs and 156 jack-up rigs, representing 19% of the global OSV fleet, 18% of the global OCV fleet and 27% of the global jack-up market, according to VesselsValue data. Across all offshore asset classes, roughly one in five of the world’s vessels are based in a region that has effectively stopped operating. Oil and gas fields across Saudi Arabia, Kuwait and Qatar are all impacted by the closures.
As the conflict continues, the market could begin to split across global regions in the medium- to long-term, though much remains uncertain. Inside the Gulf, a large proportion of the stranded fleet is built for benign, shallow water operations and lacks the specifications to compete in more demanding markets, leaving these vessels effectively trapped.
Outside the Gulf, Brent crude above $100 per barrel makes previously marginal projects in West Africa, Brazil and the North Sea more attractive, which could drive increased OSV and OCV demand in those markets. Should higher specification vessels begin to reposition to meet this demand, global supply in those markets could tighten further, adding upward pressure on rates and presenting a broader upside for the offshore market outside the Gulf.
Iran Conflict Sends Mixed Signals for Dry Bulk
By Mikkel Nordberg | March 24, 2026
While the dry bulk segment is not as exposed as oil and gas tankers to the impacts of the conflict in the Middle East, it will not go unscathed. The situation may prove to be a double-edged sword for the segment: short-term inefficiencies and rerouting could support the market, while longer-term economic effects risk turning negative.
Rerouting, inefficiencies & coal-switching support demand
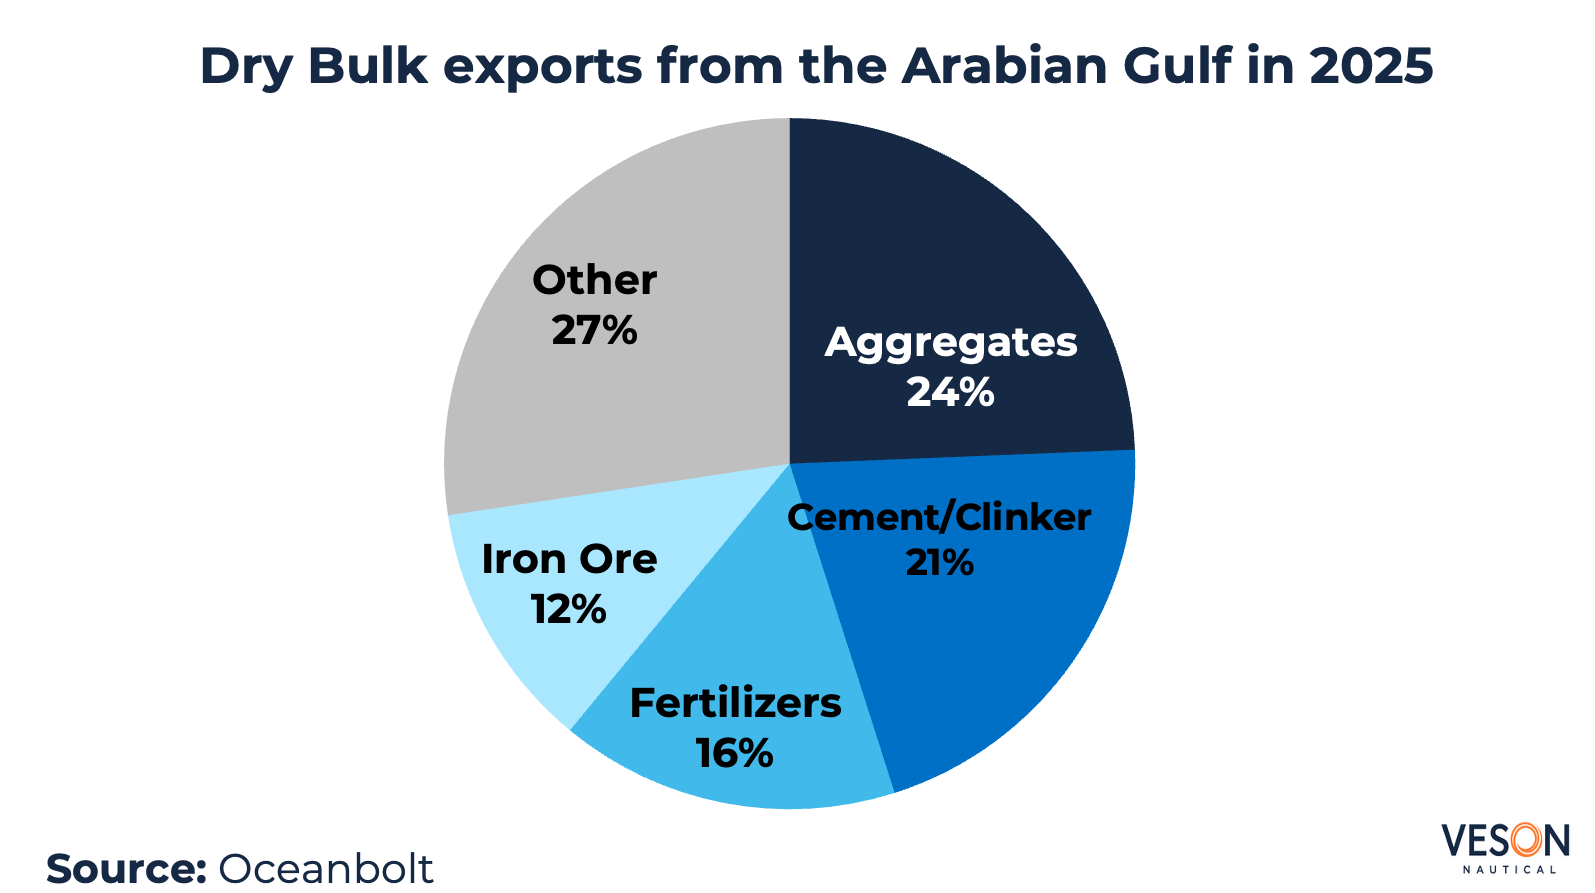
The most immediate impact stems from the de facto closure of the Strait of Hormuz, which has brought Arabian Gulf exports to a near standstill. According to VesselsValue Trade data, roughly 3% of total dry bulk trade passes through the strait, including aggregates, iron ore, fertilizers, and cement. Sourcing these materials from alternative origins introduces longer sailing distances and operational inefficiencies, which support freight rates.
Additionally, approximately 1.4% of the global dry bulk fleet is currently trapped within the strait, constraining vessel availability and limiting supply. Meanwhile, the Houthi militant group has pledged to continue its attacks in the Bab-el-Mandeb Strait in solidarity with Iran. Rerouting away from the Red Sea is expected to persist, with Red Sea transits for dry bulk vessels already down 50% compared to pre-attack levels. These factors are contributing to tighter vessel supply and firmer freight rates.
Higher gas prices and limited availability could prompt a switch from natural gas to coal in energy production. Moving to a cheaper energy source may help contain energy prices, but it could equally become a necessity from an energy security perspective. This would boost coal trades and prove positive for the bulker market.
High energy costs weigh on long-term dry bulk outlook
However, this more optimistic scenario for dry bulk carries a significant caveat: high oil and gas prices. Elevated energy costs are a drag on global economic activity, which would ultimately weigh on dry bulk demand.
With roughly 15% of the world’s seaborne fertilizer trade originating from the Arabian Gulf, a meaningful ramp-up of production elsewhere would be required to cover the shortfall. This gap is unlikely to be filled in the interim, given that natural gas is a key input in fertilizer production, with availability constrained by the closure of the Strait of Hormuz. This would not only reduce fertilizer trade volumes, but could also limit grain production in the coming harvest season.
Concerns over oil availability have driven a sharp rise in bunker prices, with Singapore VLSFO roughly doubling from approximately 500 USD/t in February to around 1,000 USD/t towards the end of March. Higher bunker costs significantly increase overall transportation expenses, which could suppress demand for dry bulk shipping.
The longer the conflict persists, the greater the potential damage to energy infrastructure, the higher energy prices could climb, and the more negative the effects on the global economy and dry bulk trade will become.
Despite Persian Gulf closures, vehicle carrier demand may rise in short-term
By Andrea De Luca | March 20, 2026
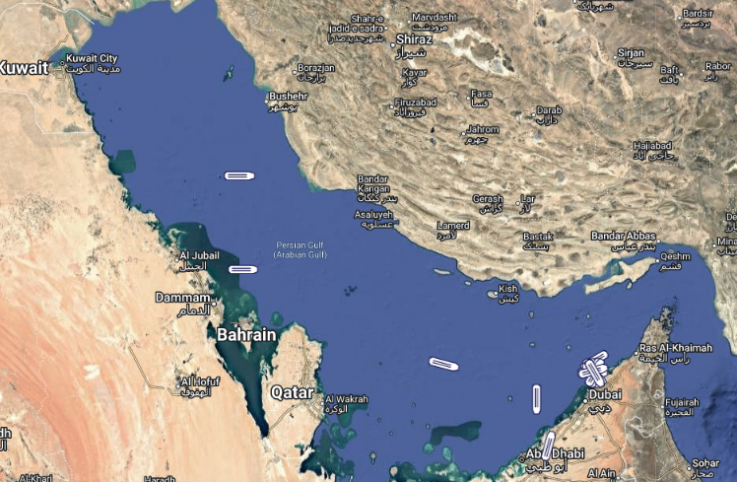
The Persian Gulf remains de facto closed today, with 17 Vehicle Carriers anchored awaiting further instruction, noting all liner services are currently suspended. Inbound car deliveries continue into Saudi Arabia via the Jeddah Islamic Port — either through a significant Cape of Good Hope deviation from Asia to avoid the Bab al-Mandeb Strait, adding substantial voyage cost, or direct from Asia depending upon the carrier.
The scale of the market exposure is significant: the UAE, Saudi Arabia and neighbouring Gulf states collectively imported over 900,000 Chinese light vehicles last year, and a sustained Hormuz closure could remove c.15% of China’s seaborne vehicle exports and c.10% of global Vehicle Carrier demand.
That said, the demand picture is more nuanced than the headline figures suggest. Lost Gulf-bound volumes could be partially offset by containerised cars returning to RoRo modalities from China, estimated at c.1 million units shipped around the globe. Additionally, China is likely to target the European market more aggressively, which would support car-mile demand. This dynamic suggests that, contrary to the broader demand contraction narrative, charter rates may face upward pressure in the short term before an eventual correction materializes. VesselsValue 1-Year TC Index for 6,500 CEU is currently 50,000 USD/day, up 13% vs the Jan-Feb average.”
Global LNG supply at risk as Middle East conflict grows
By Jarl Milford | March 20, 2026
The Middle East conflict introduced fresh uncertainty to global energy markets this week after reports of damage to the Ras Laffan LNG terminal in Qatar raised significant supply concerns. As the world’s largest LNG export hub — with a production capacity of 77 MT per year and a share of roughly 20% of global LNG supply — any disruption at Ras Laffan carries major market implications.
QatarEnergy confirmed damage on its LNG infrastructure with repairs expected to take three to five years. 12.8mtpa, representing approximately 17% of Qatar’s total LNG output, is now sidelined. A meaningful share of global supply has effectively been removed from the market for the foreseeable future. Gas markets have responded sharply, with TTF prices more than doubling since the conflict began, including a 20% surge since Wednesday alone.
What we are unfortunately beginning to witness are domino effects of a sustained disruption to the global energy system. According to the BBC, nearly 400,000 workers in Morbi, India’s ceramics hub that accounts for roughly 80% of the country’s tile and sanitaryware output, have been idled after factories shut down due to propane and natural gas shortages as a result of regional disruptions. A more than $8bn industry that exports to the Middle East, Africa and Europe has ground to a near halt. And Morbi is unlikely to be the last example.
Strait of Hormuz tensions drive up used vessel prices
By Rebecca Galanopoulos | March 17, 2026
Rising tensions around the Strait of Hormuz have had a significant effect on the used VLCC segment. Disruption to normal transit routes has prompted cargo owners and operators to reassess fleet positioning, with some loadings from the Arabian Gulf rerouted via the East-West pipeline to the Red Sea port of Yanbu. This rerouting has altered ton-mile demand dynamics, and periods of elevated freight rates have fed through into stronger asset valuations as owners capitalise on improved earnings.
The situation has also buoyed secondhand Tanker asset values, due to the disruption in trade flows and fleet positioning. This adds to other factors driving up used Tanker prices, including the large-scale sanctioning of vessels into the so-called dark fleet, which has progressively removed compliant tonnage from the trading supply pool and created a structural imbalance where legitimate demand has consistently outpaced available supply. Finally, the recent aggressive acquisition campaign by Korean operator Sinokor has included the purchase of 56 vessels in 2026 alone, an unprecedented level of buying activity that has further tightened supply and pushed values higher. For example, 15-year-old VLCCs of 310,000 DWT have appreciated by approximately 31.74% year-to-date, rising from USD 59.57 mil to USD 78.48 mil.
Iran conflict could send shockwaves across LPG shipping, ammonia, and energy supply chains
By Jarl Milford | March 12, 2026
Ongoing disruptions in the Strait of Hormuz continue to worry energy markets, particularly after six commercial vessels have been targeted in recent days. Vessels are still waiting for a safe passage through the strait, and the recent escalation does not point towards imminent safe transit.
This development has already led to increased energy prices, and with LPG, LNG and ammonia volumes running through this critical chokepoint, the ripple effects across global energy, petrochemicals and food production could worsen significantly the longer the situation persists.
The escalating disruptions will have significant implications for the LPG global supply chain. C.30% of global LPG is exported from the Middle East, almost all of which is headed to Asia. A major proportion of this LPG is used as a feedstock for producing other petrochemical gases used to power a variety of household consumer goods, including clothes, carpets and dishwashers.
If the transit disruption continues, we could see not only higher prices on a variety of these goods but could ultimately risk supply shortages. We are already seeing Asian crackers reducing operating rates and some declaring force majeure because of the ongoing conflict.
Ammonia trade is also facing disruptions, with c.25% of global ammonia exported from the region, half of which goes to India. C.70% of global ammonia production is used for producing fertilizers. With higher natural gas prices in Asia, we could see less ammonia produced and available for global trade, which could hurt food production in India and other Asian countries.
LNG shipping is also heavily affected, with c.20% exported from the Middle East with c.90% headed to Asia. The gas is mainly used for power generation, and with competition from Europe for US LNG supply, we might see increased use of other energy sources, such as coal. For countries with less fuel-switching flexibility it could pose a serious energy security concern.
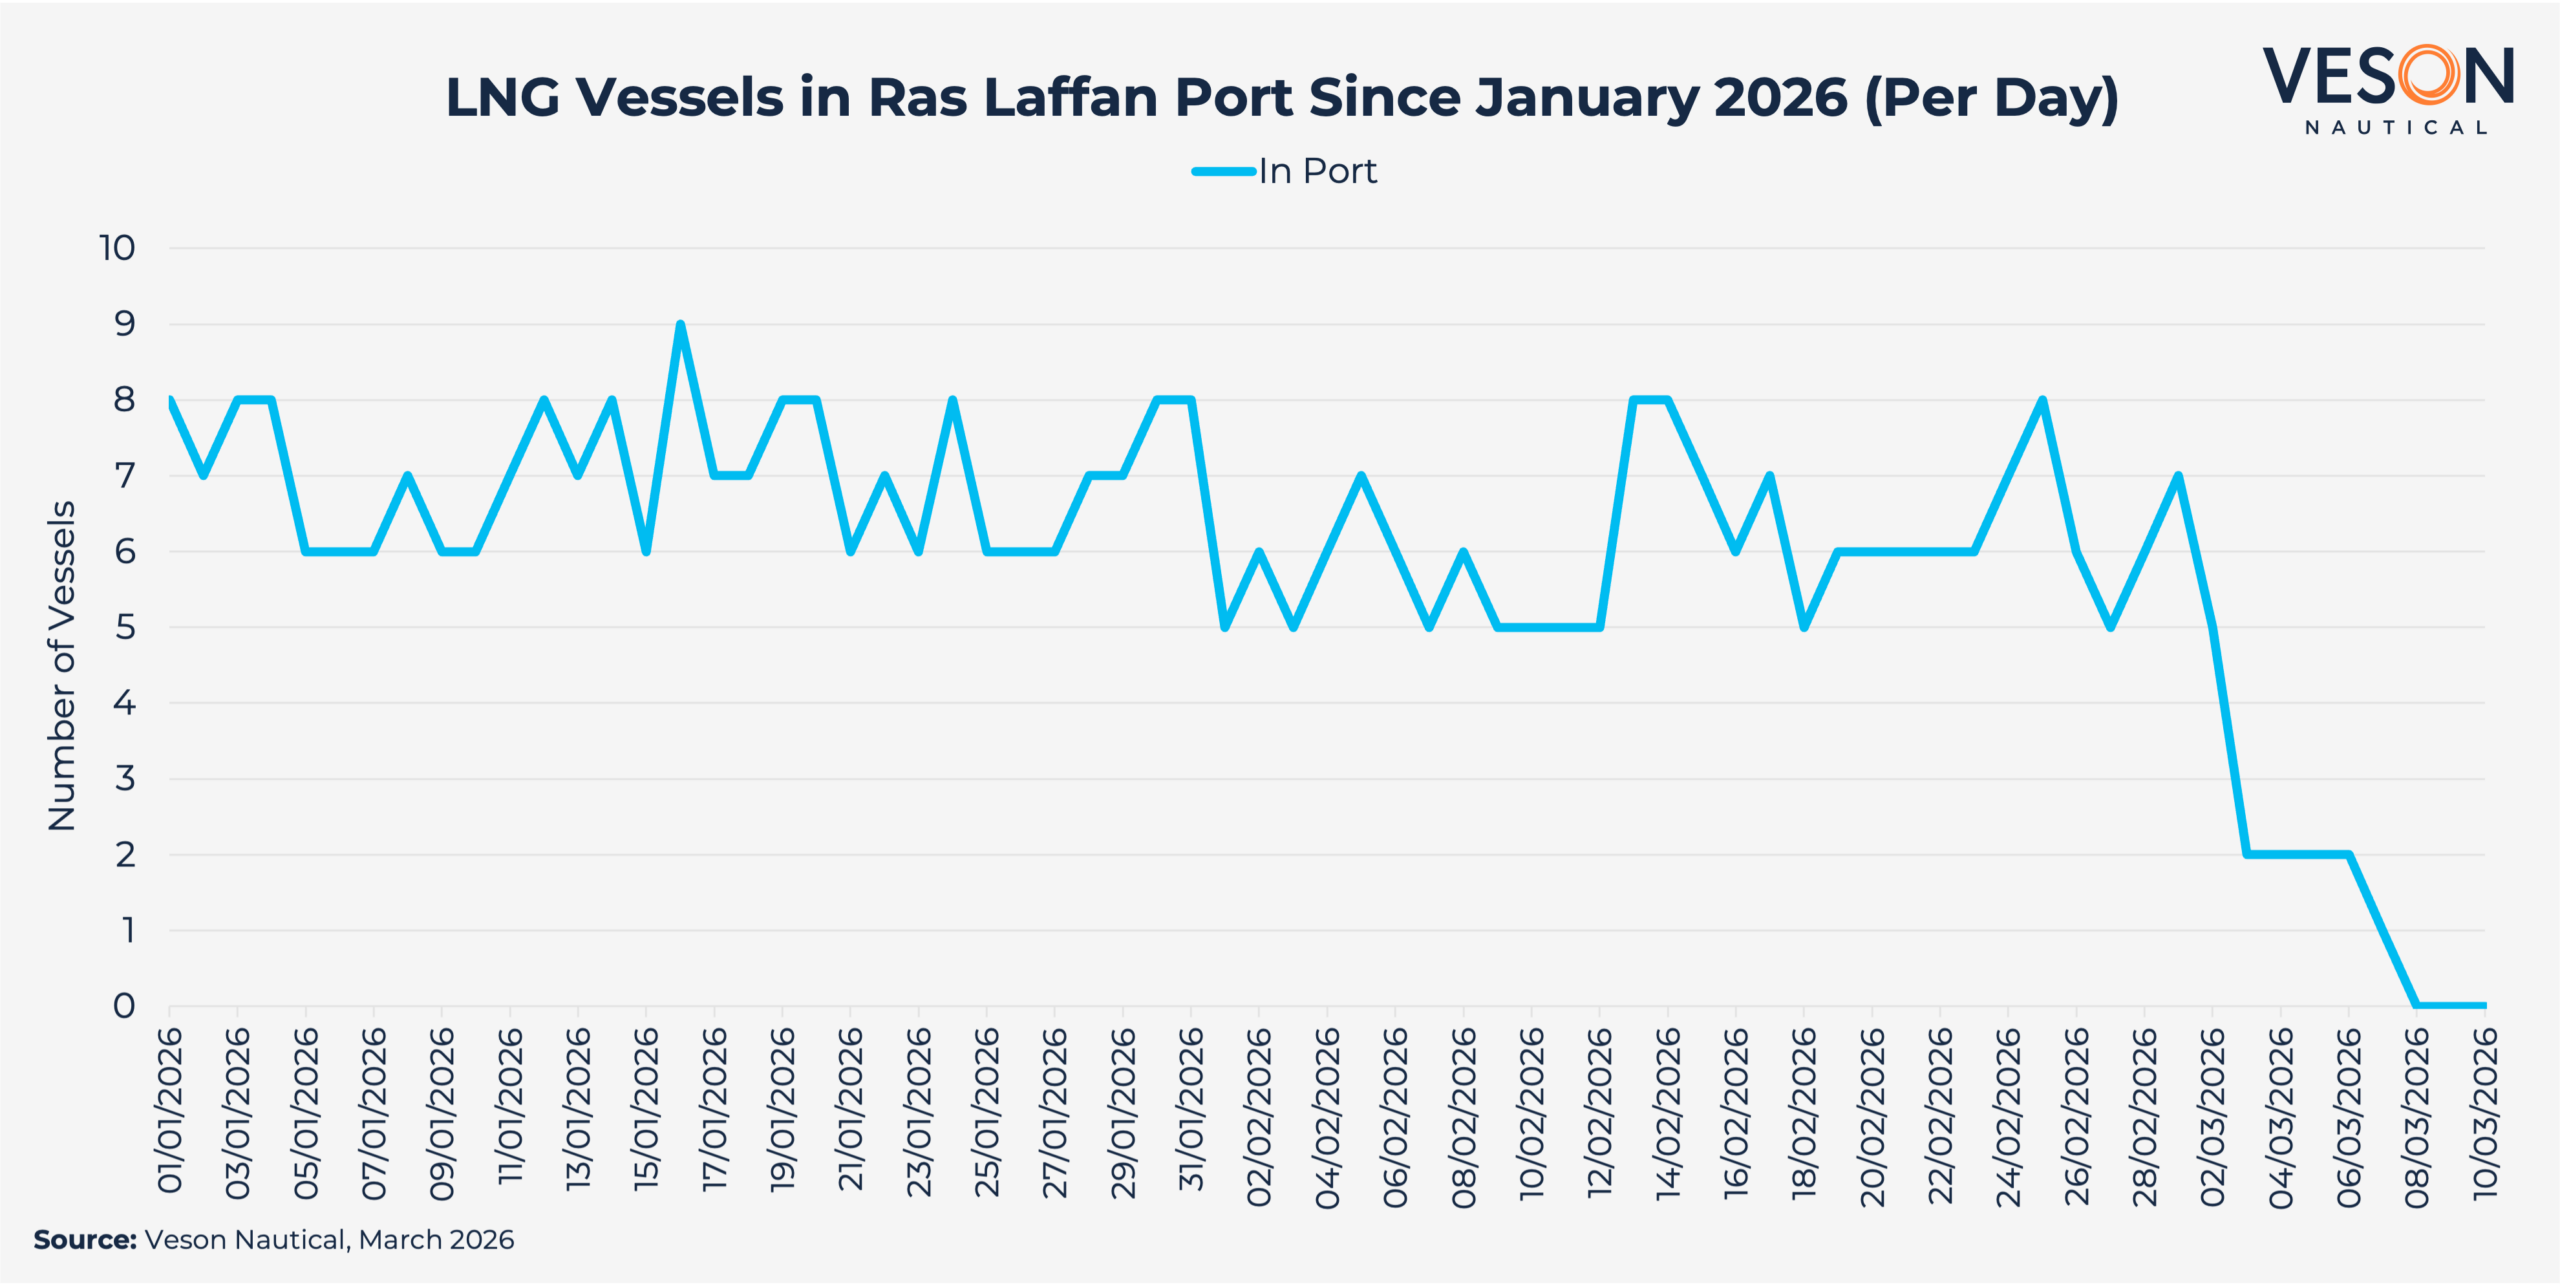
Vessel tracking data from Qatar’s Ras Laffan port illustrates the dramatic impact of the Middle East conflict on LNG exports. Daily LNG vessel calls at the terminal averaged 6-8 calls per day through January and February, before collapsing to near zero earlier this month following attacks on the facility.